17 May 2020 3:11
#25439
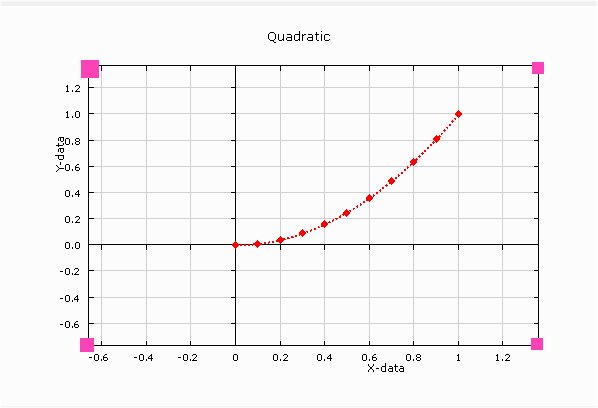
module example
USE clrwin
INTEGER , PARAMETER :: N=10, gw=1000, gh=800
REAL*8  :: x(N),y(N)
integer :: handle_internal_gr = 1, handle_pl = 2, rb_control = 1
   contains
        integer function create_data()
        integer i
          DO i=1,N
            x(i)=0.1d0*(i-1) ; y(i)=x(i)*x(i)
          ENDDO
          create_data = 2
       end function create_data

       integer function plot()
       integer, save :: iw
         iw = CREATE_GRAPHICS_REGION@(handle_internal_gr,gw,gh )
         if ( iw .ne. 1) STOP 'Failed to create internal graphics region'
         iw = winio@('%mn[Close]&','Exit')
         iw = winio@('%`bg[white]&')
         CALL winop@('%pl[width=2,y_max=0.9,framed,etched,x_array,link=curves,symbol=1,colour=red,gridlines,smoothing=4]')
         iw = winio@('%`^pl[full_mouse_input]&',gw,gh,N,x,y, handle_pl, pl_cb)
         iw = winio@('%`rb[Show Moose X,Y data]&',rb_control)
         iw = winio@(' ')
         iw = DELETE_GRAPHICS_REGION@(handle_internal_gr)
         plot = 2
      end function plot

      integer function pl_cb()
      character(len=30) cb_reason
      character(len=100) output_string
      integer i, x1p, y1p
      real*8 x1r, y1r
      integer, save :: c_yellow, c_black
      logical, save :: first = .true.
        if (first) then
          c_yellow = rgb@(255,255,0) ; c_black  = rgb@(0,0,0) ; first = .false.
        end if
        cb_reason = clearwin_string@('callback_reason')
        if (cb_reason .eq. 'PLOT_ADJUST') then
          ! Other functions triggered by PLOT_ADJUST come here.
          ! etc.
          ! Now copy graphics region created by pl to internal memory
          i = COPY_GRAPHICS_REGION@(handle_internal_gr, 1, 1, gw, gh, handle_pl, 1, 1, gw, gh, 13369376 )
        end if
        if (rb_control .eq. 1) then
          if (cb_reason .eq. 'MOUSE_MOVE' ) then
            x1p = CLEARWIN_INFO@('GRAPHICS_MOUSE_X') ; y1p = CLEARWIN_INFO@('GRAPHICS_MOUSE_Y')
            i = GET_PLOT_DATA@(x1p,y1p,x1r,y1r)
            if ( (x1r .ge. minval(x)) .and. (x1r .le. maxval(x)) .and. (y1r .ge. minval(y)) .and. (y1r .le. maxval(y)) ) then
              write(output_string,'(A2,F5.3,A1,1X,F5.3,A1)') ' (',x1r,',',y1r,')'
              ! Recover back up graphics region from memory to screen and annotate
              i = COPY_GRAPHICS_REGION@(handle_pl, 1, 1, gw, gh, handle_internal_gr,  1, 1, gw, gh, 13369376 )
              call draw_filled_rectangle@(x1p, y1p, x1p+140, y1p+20, c_yellow)
              call draw_characters@(output_string, x1p, y1p, c_black)
            else
              ! Mouse moved oustide data region, so any existing annotations need to be removed.
              i = COPY_GRAPHICS_REGION@(handle_pl, 1, 1, gw, gh, handle_internal_gr, 1, 1, gw, gh, 13369376 )
            end if
          end if
        end if
        pl_cb = 2
      end function pl_cb
END module example

program main
use example
implicit none
integer i
  i = create_data(); i = plot()
end program main
 ](
](