Silverfrost Forums

Welcome to our forums

%PL - some issues/questions

14 Jun 2020 9:52 #25636

Exactly.

If you don’t like having to include spaces in the strings an alternative form is:

character(len=19) :: fmt(1:2)
data (fmt(i),i=1,2) /'(SP,F10.2,1A,F11.2)','(SP,2X,A3,1X,F5.2)'/

But you loose the protection provided by the PARAMETER declaration in the earlier version.

Ken

14 Jun 2020 10:41 #25637

Thanks Ken!

As I see, you have an unlimited flexibility! Each of your posts is for me a teaching class, thanks again!

I still would like to know, as I already mentioned earlier and recently, more or less the same question was also put by John Silver:

Is there (when using %PL command) any feasible possibility to influence where the captions for the (X,Y) axes appear (including change of their fonts and their colour)?

I found nothing in the on-line help. Namely, at present stage, as I mentioned yesterday, the captions practically touch the numbers and have the same font and colour (they blend with the graphics) and this is not good for illustrations.

Another question: I found in the on-line help the following options (for the %PL command): [box_selection], [line_selection], [free_selection]

Unfortunately, there are absolutely no comments/description how to use them and what can be achieved when using them.

Do you have some descriptions about the above mentioned options?

Next question: Is there already a fix available (a new dll) for SYMBOL=12 and SYMBOL=13 options? They behave unpredictably when zooming in/out the graphics and mostly change their original graphical look to another symbol. If there is/are new DLL(s), where could I download it/them?

Martin

14 Jun 2020 11:10 #25638

Here is a quick response to some of these questions.

  1. Adjustments can be made to the positions of the title and captions by adding an @ with brackets and offsets as illustrated here...

    CALL winop@('%pl[y_axis=Amplitude@(-4,0)]')

  2. The latest DLLs (including new %pl symbols) are available from here... https://www.dropbox.com/s/mlrd848w3ixnlp3/newDLLs47.zip?dl=0

  3. Box selection etc. are inherited from %gr and information can be found under %gr.

There is a plan to release more information about %pl within the next few days.

14 Jun 2020 11:38 #25641

Thanks Paul!

I will apply the adjustment and post it how it looks when applying it.

14 Jun 2020 1:29 #25643

Paul,

thanks - the captions for X,Y axes can be moved as I wished!

I used the code:

...
...
 CALL winop@('%pl[x_axis='Y_S-JTSK [m]@(0,20)']') 
 CALL winop@('%pl[y_axis='X_S-JTSK [m]@(-20,0)']')
...
...

and the result can be seen below (now, I am satisfied with their placement!)

[ https://i.postimg.cc/hGWGGsXT/Caption-X-Y-posun-OK.jpg ](https://postimg.cc/Jsx86bcz)

But I still need your advise. I want to have the caption text (Y_S-JTSK [m] and X_S-JTSK [m]) for both axes in different font (verdana and bold for exmple) and colour (as blue, for example and maybe also graph title in blue).

I tried to use the following code:

     iw = winio@('%fn[Verdana]%bf%gf%tc[blue]&',cval)
     CALL WINOP_CLR@('%pl[x_axis=]', cval) !for colours
     CALL WINOP_CLR@('%pl[y_axis=]', cval) !for colours

but it does not work (I tried some combinations and in one instance I achieved that the whole numbers/captions/graph title, all were blue). Could you tell me how to achieve it?

Thanks in advance!

Martin

14 Jun 2020 1:38 #25644

All the text has the same font except that you can change the font for the title and keep the other fonts the same.

The general font is set using %fn before %pl.

To change the font for the title see item 406 in cwplus.enh...

        integer(7) hTitleFont
        ...
        iw = winio@(\'%fn[Verdana]%ts[1.2]%it%gf%sf&\',hTitleFont)
        CALL winop_hdl@(\'%pl[title_hfont]\',hTitleFont)
14 Jun 2020 2:36 #25645

Thanks for the info. I already changed the font for the title earlier. Maybe it could be worth to add these possibilities (changing the fonts/colours for the axis captions) in some next releases.

Again - thanks for your advises!

14 Jun 2020 4:07 #25648

If you prevent %pl from drawing the axis labels via

%pl [x-axis=@,y-axis=@]

You can then add your title and axis captions using any font/size/colour by using the %gr routines within the %pl callback.

SELECT_FONT@, ROTATE_FONT@ and DRAW_CHARACTERS@

Defining the margins of the %pl region and GET_TEXT_SIZE@ helps with the positioning.

14 Jun 2020 5:49 #25649

Paul, The new DLLs work fine for WIn32 - I can see that the bug with symbol 12 has been fixed.

But with x64 there seems to be a problem. This example fails.

i = winio@('%ws','Here')
print*, i
end 

Can somebody else confirm this? Or maybe I have I messed up my installation?

[color=red:db6240bcff]Note

Same issue with my back up machine - so both are now back to the previous set of DLLs.[/color:db6240bcff]

15 Jun 2020 6:41 #25655

It works OK for me. I what way does it fail?

15 Jun 2020 8:38 #25656

Console opens, no Clearwin window created, no data printed to console, then terminates itself.

15 Jun 2020 9:39 #25657

I plan to upload new DLLs within the next few days and hopefully this problem will prove to be resolved.

15 Jun 2020 10:30 #25660

Fingers crossed Paul.

There's been a large number of intermediate releases (debugers, FTN, Plato etc) since the last official release and I am just wondering if I have perhaps missed something critical?

16 Jun 2020 11:56 #25670

Ken,

I tried to change the font/colour/size of X/Y captions in the graphics. Couple of observations (better said problems) related to this:

  1. First, I thought that I could call within %PL more than one call-back, so I defined a separate function in my module as follows (because I wanted that any effect in changing font/colour/font size would relate to ONLY X/Y axis captions):

    INTEGER FUNCTION nazvy_osi ()

           CALL select_font@('arial') ! font selection
           CALL bold_font@(1) ! bold setup
           CALL size_in_pixels@(15,15) ! dimensions in pixels
    

    ! CALL size_in_points@(15,15) ! dimensions in points CALL draw_characters@('Y_S-JTSK [m]',600,630,RGB@(255,0,255)) CALL rotate_font@(90.0d0) ! for vertical axis caption CALL draw_characters@('X_S-JTSK [m]',70,350,RGB@(255,0,255)) nazvy_osi = 2

    END FUNCTION nazvy_osi

Then - in the plot graph function I had the following:

...
...
iw=winio@('%^pl&',nazvy_osi) 
     iw=winio@('%`^pl[full_mouse_input]&',gw,gh,npoints,y_hr,x_hr,y,x,handle_pl,pl_cb)
...
...

During compiling, I got (sometimes, sometimes not) a message saying about memory access violation, but at the end (regardless whether this message appeared or not) compilation was done. When I build the executable, as soon as I accessed graphics menu, program crashed (run time error saying that in the 2nd WINIO continuation (command: iw=winio@('%^pl&',nazvy_osi) integer argument was expected or something similar.

So, I abandoned this %PL call-back.

  1. I integrated the commands contained in the integer function above to the main %PL call-back which draws full graphics (called pl_cb in the command: iw=winio@('%`^pl[full_mouse_input]&',gw,gh,npoints,y_hr,x_hr,y,x,handle_pl,pl_cb) at the end of this pl_cb call-back.

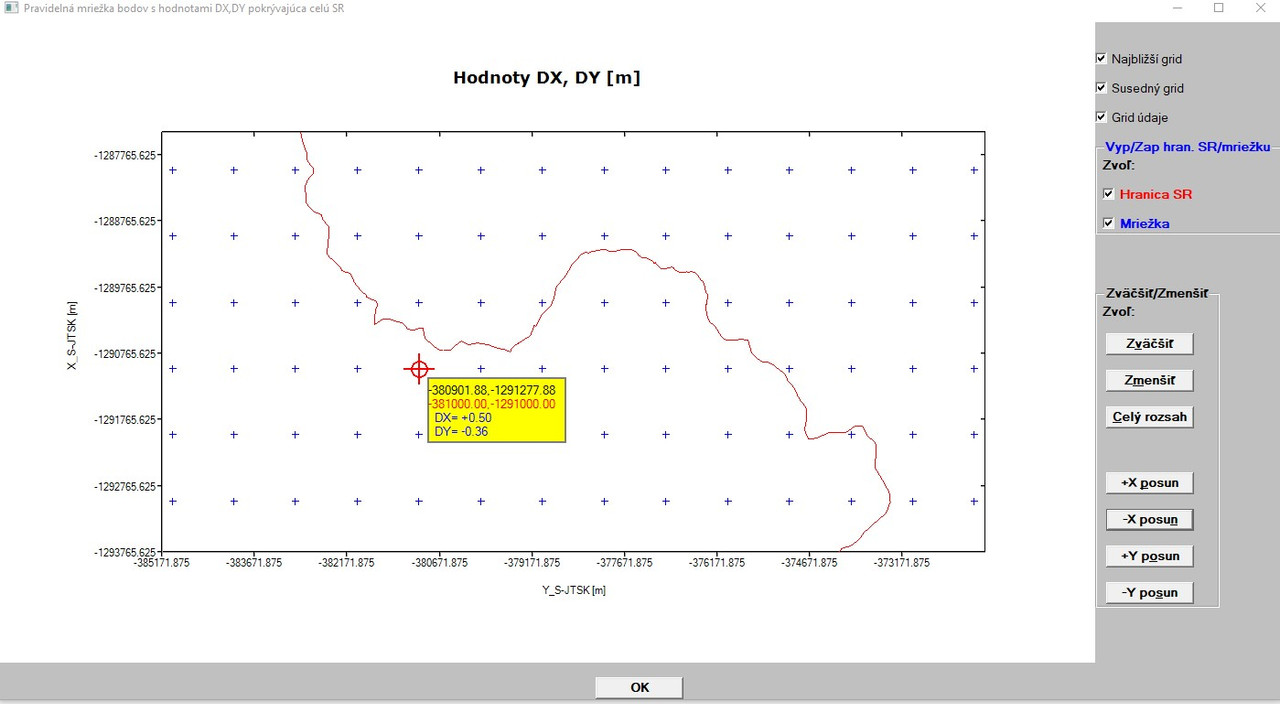
After this, I had to leave out the command ROTATE_FONT@(90.0d0), since it caused that NOT ONLY vertical axis caption was rotated (this was required), but ALSO all values in the yellow rectangle were perpendicular to horizontal axis (unwished effect). When I commented out this function, initially, graphics looked promising (see picture below):

https://i.postimg.cc/pdhbmK59/Zmena-fontov-farieb-velkosti-XY-nadpisu-v-grafe-closing-reopening.jpg

By the way, I also had to enlarge the yellow rectangle, since it was too small when I defined also bold type and dimensions in pixels/points. The reason is that also these values (in the yellow rectangle) are drawn as characters using DRAW_CHARACTERS@ function and UNFORTUNATELY, any change in font/colour/font size has effect NOT ONLY on X/Y captions (as I thought and wanted), but also on ALL characters appearing in the graphics (except the title graph, which I drew by another way).

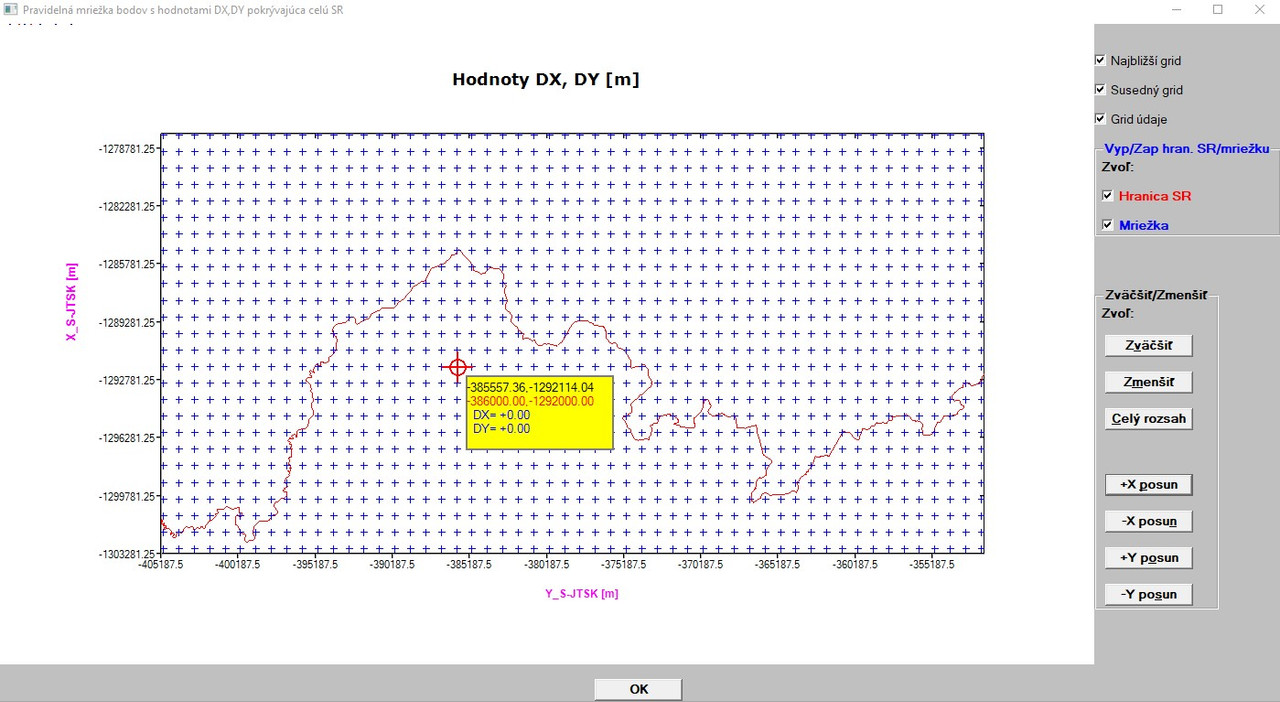
Next, I zoomed in the graphics and the result can be seen below:

https://i.postimg.cc/DZ3vFxpf/Zmena-fontov-farieb-velkosti-XY-nadpisu-v-grafe.jpg

Clearly, the Y,X coordinate values (at the bottom and to the left) and the X/Y captions are in disarray.

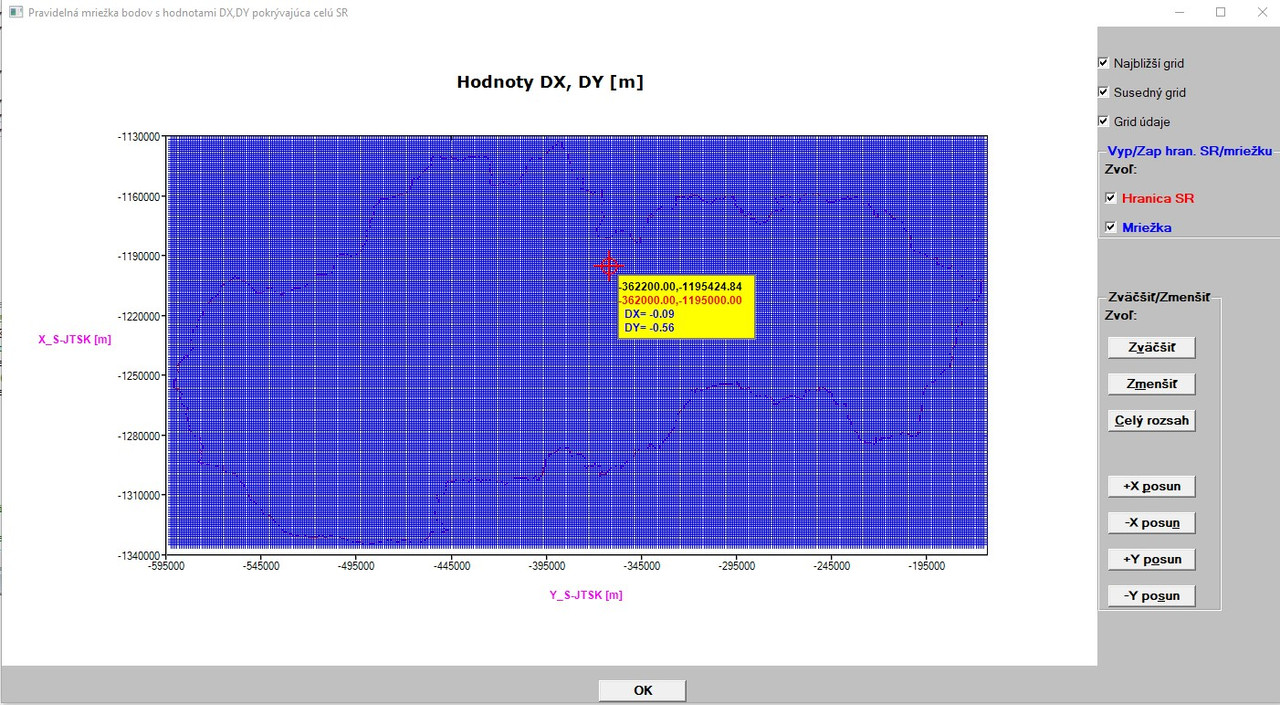
Then, I used zoom to extents function (result is demonstrated below):

https://i.postimg.cc/mrs9py3M/Zmena-fontov-farieb-velkosti-XY-nadpisu-v-grafe-po-zoom-to-extents.jpg

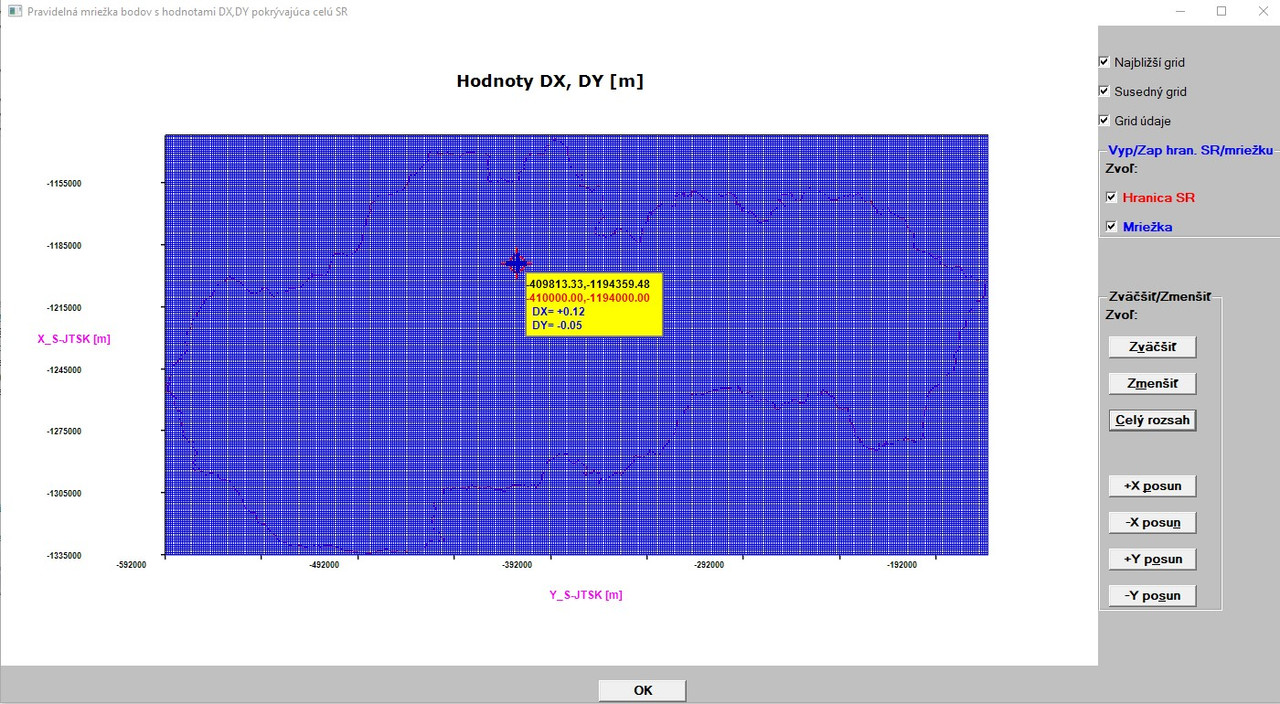
While X/Y captions seems to be OK, the X/Y values on the axes remain in disarray.

So, basic knowledge is (at the current level of my knowledges which are quit low with respect to this and to the way how I tried to realise it) that ALL characters drawn in a graphics (when using %PL command) are influenced by change of font/colour/size and I did not find the way how to isolate/separate the characters which are wanted to be changed (X/Y captions) from the others, which should be left unchanged.

My question: Is it not possible to call more than one call-back in conjunction with %PL command found in one integer function? (this I see as most important, because I saw here a possibility how to separate the characters in the graphics which are to be changed with font/colour/size) from the ones which should remain unchanged and if it is possible, where am I wrong?

As an assessment from a common user (occasional programmer) - by far - the easiest way would be to ADD new options for the %PL command such as: [x_axis_font=], [x_axis_fontsize=], [x_axis_fontcolour=] (and the same for Y axis) and maybe something more with good documentation (help).

So, if you have some ideas/comments/recommendations how to make some tricks to achieve the above described goal in current status of the %PL possibilities, I would be thankful.

Martin

16 Jun 2020 12:10 #25671

something went wrong with my latest post - here is the missing part:

.. which are wanted to be changed from the others which should remain unchanged.

Most important question is: Is it not possible to call with %PL command contained in one integer function more than one call-back? I saw this as a way how to separate the influence of changes in font/colour/size on X/Y captions from the others and if it is possible, where am I wrong?

As an assessment from a common user (occasional programmer) - by far - the easiest way would be to ADD new options for the %PL command such as: [x_axis_font=], [x_axis_colour=], [x_axis_fontsize=] (the same for Y axis) and maybe a few more options along with good help (documentation).

So If you would have some ideas/comments/recommendations whick trick(s) could overcome current status of the %PL , I would be thankful.

Martin

16 Jun 2020 7:58 #25677

Martin,

I am not surprised that your first attempt failed. The code it trying to produce two pl regions.

The function to draw the text should be called in the main pl call back within the if “plot adjust” logical test. Do this before you call COPY_GRAPHICS_REGION@ to copy the %pl to the “back up” internal graphics region.

After a call to rotate_font@(XX), it’s always a good idea to call rotate_font@(0.d0) immediately after you have completed the drawing operation with the text at an angle of XX.

Yes the characters in the yellow box will change. It’s drawn on the same graphics area as the %pl and prior to the call to draw the title text this would be at some default value probably defined by %fn before immediately before the %pl call – if I understand the user’s guide.

Generally I only use a single font and simply scale or rotate it where necessary.

You could open another window to display the internal %gr region. Then by adding a number of calls to SLEEP1@ at strategic points in the code, you can follow the progress of the various call back functions as they operate on each of the graphics areas.

Ken

17 Jun 2020 11:54 #25682

Thanks Ken!

Now, I can zoom in/out/to extents as many times as I want and the X,Y captions retain always all their properties as I programmed it for them (picture below)!

https://i.postimg.cc/qMfKK4g1/X-Y-coloured-captions-zoom-in-out-extents-OK.jpg

I also incorporated switch on/off option for the bubble help (picture below)!

https://i.postimg.cc/MGY5PXfZ/Bublinova-pomoc.jpg

One question more (your answer will avoid my thinking in wrong direction):

I also have a raster image (.bmp) of the grid with SK borders which can be seen under one menu option (there is also scale on the picture which corresponds to the reality).

I would also like to add a possibility in the menu option to zoom in/out/to extents using %SL (slider) in connection with mouse wheel. It means, as the wheel would spin, the raster picture would zoom in/out). Is this idea with the %SL command in connection with mouse wheel feasible or is there a more appropriate % command to use for such purpose?

Martin

17 Jun 2020 3:34 #25689

See item number 351 in cwplus.ehn.

Please login to reply.