Ken,
many thanks - thanks your invaluable help! I come near to my goal, although, at the moment I am not still in it.
Namely - I have still two (I think - minor) problems.
I appended the array with the points which are NOT be joined (21st graph, points X_MM,Y_MM) to the end of last section of points
(20 graphs. all points X_OK, Y_OK) which are to be joined by straight lines, every section separately, no cross section joining.
But first, an observation regarding the PACK function:
At least in my case, the function PACK
behaves unpredictably (maybe I don´t use it in proper way, but I don´t think so)
and I cannot use it.
The code:
...
      IF (ALLOCATED (D)) DEALLOCATE (D)
                    ALLOCATE (D(en))

          d(1:en) = 0 ! initialisation of D array
          d=pack(section_points,mask=section_points.ne.0) ! to exctrat all NON-zero values of D-array
...
does not produce required results.
Therefore, I wrote a short code, which - in my case - replaces the PACK functionality as follows:
...
	p=0 ! initialisation of an auxiliary variable

					DO i=1,k,1
                      IF (section_points(i) == 0) CYCLE
                      IF (section_points(i) /= 0) THEN
                        p=p+1
                        D(p) = section_points(i)            ! to extract NON-zero values from the array SECTION_POINTS,
                                                            ! in fact, the NON-zero values represent the number of points to be joined by lines in each separate section of points
                      END IF
                    END DO
...
When I use my code above, I get the following correct results (in yellow) for the N_PL(i) array needed for the %PL to draw lines separately in each section of points:
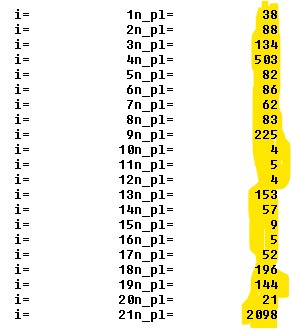
When I use the PACK function, it assigns zero values to the elemenents N_PL(1) - N_PL(20), only element N_PL(21) is OK.
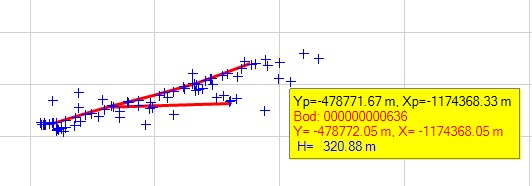
So, when invoking function GRAPHICS-vector with my code instead the PACK function, I get the following graph(s):

And in the picture above can be seen the two (minor) problems.
FIRST problem:
The points of the last (21st) graph are hidden (not visible). They should be in blue colour with + symbols.
The fact that they are present in the graph after all (but invisible), shows the yellow rectangle with the data extracted
from each blue point (here invisible) when hovering with the cursor over a blue point. Such data are NOT present when
hovering over red lines. So invisibility of blue points is unwanted.
So the question is - why are the points belonging to the last (21st) graph invisible?
SECOND problem:
If you look at the picture above to its top left section (better seen in the detail below), you see there a short line which also has point symbols with plus sign.
And this is also unwanted.
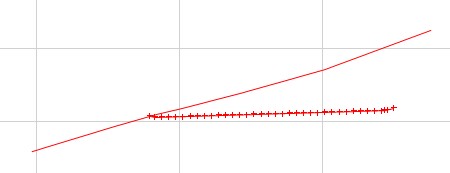
So, the question is - why on this short line and only on this short line are also point symbols displayed?
Here is full part of the code used with %PL command. Maybe here, in the code below, is hidden the answer
to the two questions above, but, unfortunately, I do not see it.
...
INTEGER FUNCTION plot_OK_MM ()
IMPLICIT NONE
iw = CREATE_GRAPHICS_REGION@(handle_internal_gr,gw,gh)
iw=joining_lines() ! the function which joins the X_OK, Y_OK points (not the points X_MM, Y_MM) by straight lines
WRITE(TXT_LINK,'('%pl[native,stacked,n_graphs=',I2,']')') pocet_roz_usekov ! pocet_roz_usekov = number of different sections (21)
CALL winop@(TXT_LINK)
DO z = 1, pocet_roz_usekov, 1
IF (z < pocet_roz_usekov) THEN
CALL winop@('%pl[link=lines,colour=red]') ! X_OK, Y_OK points, all joined with straight lines in each section separately, NO cross sectionjoining, no point sybol used
ELSE
CALL winop@('%pl[link=none,colour=blue,symbol=12,symbol_size=3]') ! X_MM,Y_MM points in blue with + point symbol, NO joining
END IF
END DO
iw=winio@('%fn[Verdana]%ts[1.4]%bf%gf%sf&',hTitleFont)
call winop_hdl@('%pl[title_hfont]&',hTitleFont)
CALL ENABLE_UTF8@(1)
iw=winio@('%ww[no_border]%ca[Mobilné mapovanie plánovanej trasy optického kábla]%bg[grey]&')
iw=winio@('%2nl%5ta%bf Zväčšiť/Zmenšiť:%ta%50sl%ta%`bg[white]%`rf%sf&',zoom,zoom_min,zoom_max,zoom) ! SLIDER
iw=winio@('%ta%bf%^bt[Celý &rozsah bežca]%sf%2nl&',full_extents_cb) ! full extents of the slider
CALL winop@('%pl[scale=linear]')
CALL winop@('%pl[gridlines]')
CALL winop@('%pl[x_sigfigs=8]')
CALL winop@('%pl[y_sigfigs=9]')
CALL winop@('%pl[title='Body z mobilného mapovania na plánovanej trase optického kábla']')
CALL winop@('%pl[x-axis=@,y-axis=@]')
CALL winop@('%pl[x_array]')
CALL winop@('%pl[independent]')
CALL winop@('%pl[frame,etched]')
CALL winop@('%pl[axes_pen=4,smoothing=4,frame_pen=1]')
iw=winio@('%vx&',vpage_step,vmax_value, vcur_val)
iw=winio@('%hx&',hpage_step,hmax_value, hcur_val)
iw=winio@('%`^pl[vscroll,hscroll,full_mouse_input]&',gw,gh,n_pl,Y_OK_U,X_OK_U,handle_pl_ok,pl_cb)
iw=winio@('%dl&',0.5d0,timer_cb)
....
Thanks in advance for your comments!