Hello to anyone,
I would be thankful, if somebody could react to my following notes/questions:
- It seems that %PL code does not work with the CALL ENABLE_UTF8@(1).
function. If you look at the title of the graph (see this picture:
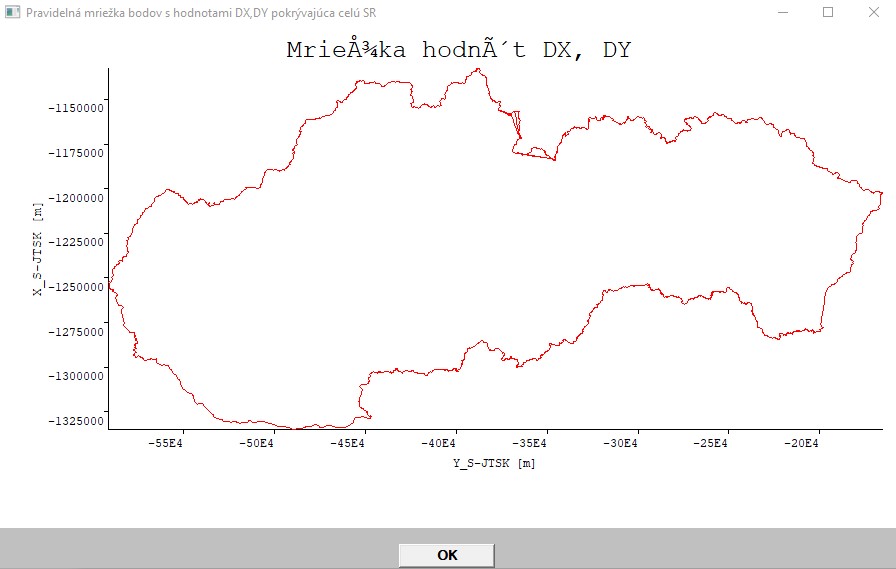 then you will see there some unreadable letters. Is it so or what´s wrong?
The %PL code is as follows:
i=winio@('%ww[no_border]%ca[Pravidelná mriežka bodov s hodnotami DX,DY pokrývajúca celú SR]%bg[grey]%pv&')
i=winio@('%bf%pl[title='Mriežka hodnôt DX, DY',x_axis='Y_S-JTSK [m]',y_axis='X_S-JTSK [m]',colour=red,x_array]&',900,500,N,y_hr,x_hr)
i=winio@('%ff%nl%cn%tt[OK]&')
i=winio@('%2nl  ')
I wanted to see the X,Y axes with texts in bold, so I used %BF%PL, but it seems it has no effect as can be seen on the picture above. Am I right? Should I understand the %PL command works in such way that it ignores any other %codes and if not, where should they be put in conjunction with %PL to see their own effect (like bold letters in X,Y axis)?
How could I tell the %PL command that I want to have displayed the Y values on horizontal axis (Y_S-JTSK) in normal (NOT scientific) format, it means as -550000, -500000, -450000, ... etc, NOT as -55E4, -50E4,... exactly as it is on the vertical axis? The format for displaying of values on both axis was automatically managed by %PL (I specified nothing).
I want to draw the whole grid of nodes with X,Y coordinates on the same picture (to overlay it). The NORTH-SOUTH direction ranges about 204km and in EAST-WEST direction about 430km. The step (distance between nodes) in both directions is 1km. How to define a suitable scale for it to have displayed the whole grid (nodes of the grid) overlaying properly the picture above (in fact, it represents the state borders of Slovakia)?
When I will have a success with drawing of the whole grid (each node will be represented by a dot or cross or something similar) over the map of Slovakia, I would like to achieve such thing that when I will hover with mouse over a node, it should display in a small bordered rectangle its DX, DY values (every node of the grid has its own specific DX,DY variations). Is it even achievable and if yes, could you get me a tip how to do it?
Many thanks in advance!
Martin