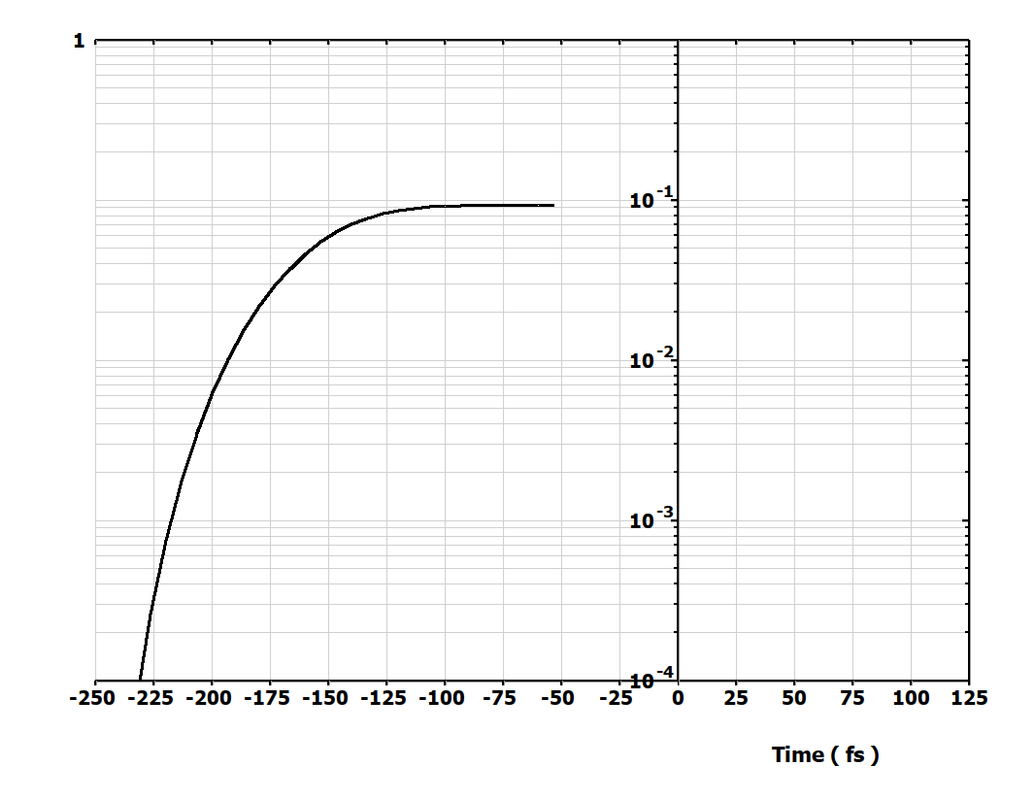
- I need both Y numbering and captions be outside the plotting area.
Can not find how in Designer's Mode to fix this plot. ('Designer's mode' or DM appears when you click on left corner icon which appears on your %PL plot when you add to your source code this line
call winop@('%pl[file=Settings.set]' )
Looks like people do not know what Designer's mode is. But it ultimately simplifies creating plot, and not just dumb plots but professionally looking plots. Nothing in the world is simpler than DM with %PL. You just write two Fortran lines and you created a plot where you are free to change anything without further programming. Just two lines!
I think there exist control to fix this problem regular way (outside the Designers mode) but i forgot it and could not find now.
And i need also that the X caption be centered on axis. There exist description in Clearwin ENH text file how to do that outside the Designers more but to me permanently in hurry it looks confusing. This option has to be default by the way. No one ever needed the current default you can see above ( of course i can move the caption in DM with 1000 clicks but...I do not have to). Am i wrong? Can people here confirm that? And this also needs to be added to DM
In the Designers mode the field for the line number is too small so that it can not show two digit line numbers. Besides you can not change this line number manually, only by clicking. Very annoying when you have many lines to change something.
Same, you can not just write the number in Tic Value Position controls, you need clicking and clicking
If you have log_linear plots and need to set minimum and maximum in Designer's Mode there is no way to write your limits like this 1.e-22 or 4.e30. You can do that only by writing it this way 0.00000000000000000001 or 40000000000000000000000000000000
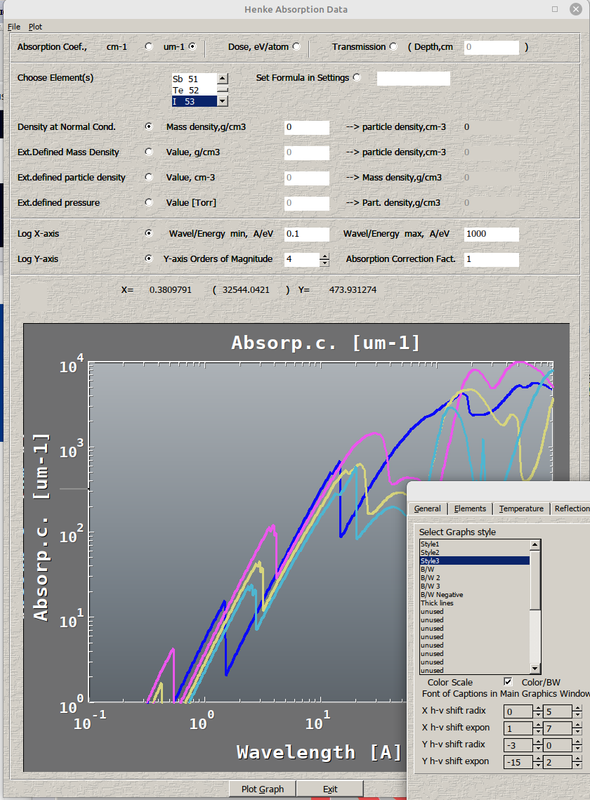
Missing left frame in above plot (or left Y axis) is also obvious despite in DM both the frame, framed and etched radiobuttons are ON.
Other defects are visible on these two examples of two-line codes inside single file.
use clrwin
parameter (N = 222)
real*8 X(N), Y(N)
Data X/0.01,0.1,1,10, 100,1000,10000,100000/
Data Y/0.011,0.044,0.33,2.2,66,3333,1111,777/
!... Regular Plot
call winop@('%pl[x_axis='X Axis Title',y_axis='Y Axis Title']')
i=winio@('%ww%pv%pl[native,x_array,scale=log_log,N_GRAPHS=1]%lw', 800,600, n, X, Y, ilw)
!... Design Mode Plot
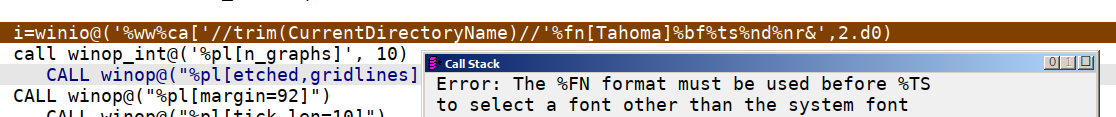
i=winio@('%sf%ts%bf%es&', 2d0)
call winop@('%pl[x_axis='X Axis Title',y_axis='Y Axis Title',file=zSetts.set]')
i=winio@('%ww%pv%pl[native,x_array,scale=log_log,N_GRAPHS=1]', 800,600, n, X, Y)
end
Two plots will be opened (one on top of the other, so separate them yourselves) , one in 'dumb mode' and another in Designer's Mode. You can edit the second plot by clicking on icon in left top corner. You can change there line width, add frame, its width, change min and max values, move titles reduce and increase fonts etc
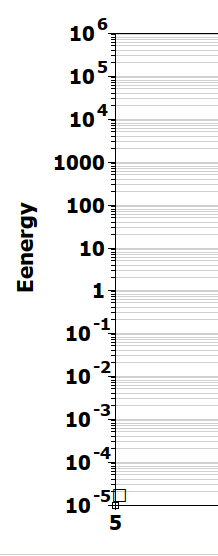
And look at birth defects too: look at Minimum and Maximum values in Designer mode. They are still shown as log10 numbers instead of being human readable ones like when the Native PL was born.
By the way you can change the defect of Y axis dumb numbering by setting there Y minimum number to -2 (means 10^-2).
Just two-three lines.
No more formatting like this:
call winop@ ('%pl[x_min=7500]')
call winop@ ('%pl[x_max=7710]')
call winop@ ('%pl[y_min=0]')
call winop@ ('%pl[y_max=130]')
call winop@ ('%pl[x_axis=X]')
call winop@ ('%pl[y_axis=SEQNUM]')
call winop@ ('%pl[color=black]')
call winop@ ('%pl[link=lines,symbol=0]')
i=winio@ ('%`pl&',iwvm,ihvm,numld,xval,yval,ighandle)
call winop@ ('%pl[x_min=7500]')
call winop@ ('%pl[x_max=7710]')
call winop@ ('%pl[y_
 Ideally would be to have numbering either
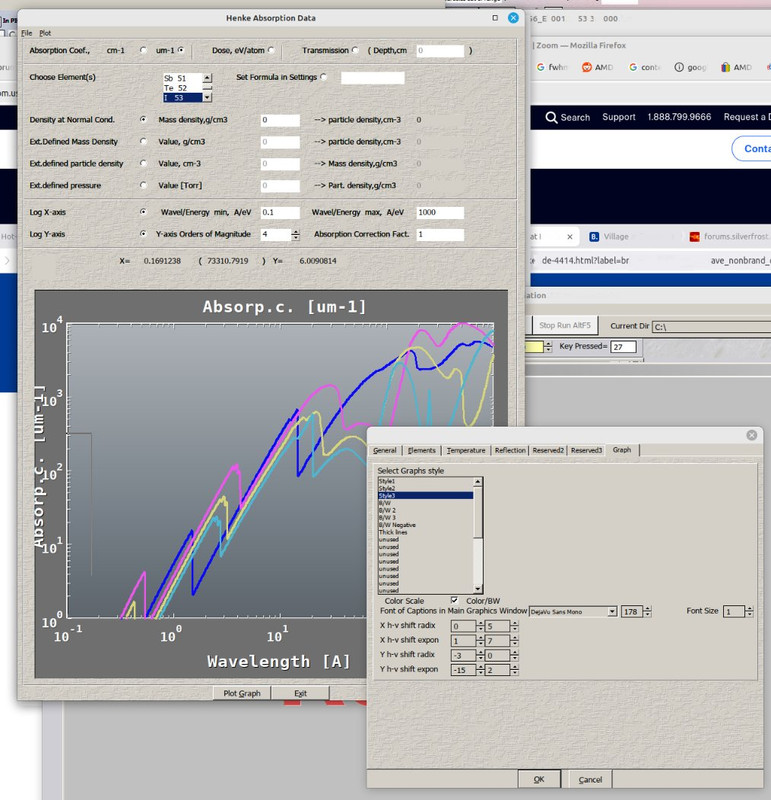 Of course you can increase the margin by adding Clearwin command and recompile the code. Or if you use Designers Mode, you can fix its position by clicking 20-30 times in the right direction. But in my app you just step on axis with your mouse and drag it to right side.