Silverfrost Forums

Welcome to our forums

Limitation of number of plots in %PL

26 Oct 2021 7:48 #28387

Paul, In your first answer to my post you have shown how to use set_plot_mode@(1) and there you have plotted an example of draw_filled_polygonD@.

Question: are polygons' borders antialiased like they are for the lines ? Here is cut from my other program which uses this method and it plots gray vertical polygons stacked one near another from left to right with gradually changing color. And also shown is the line. Clearly the line is antialiased for smoothness which is good. But what happens with the polygons is that they sometimes mess the plot by leaving antialased lines of lighter colors. The whole gray gradient has to be very smooth but it is now not. Is it possible to switch off antialiasing specifically for polygons and switch it on again for everything else?

https://i.postimg.cc/9MLy9Hq6/antialias.jpg

26 Oct 2021 7:49 #28388

Somehow i do not see antialiasing on you own example. Only numbers are antialiased https://i.postimg.cc/BnF7DCcS/Pauls-Example.jpg

Look below what the perfection can %PL create in minutes. And i did not yet used Designer mode to improve it. Why crazy fortraneers do not use Clearwin like crazy is beyond my comprehension. The only problem left is spurious antialiasing of these gradients https://i.postimg.cc/qqbBsrr3/Image43.jpg

27 Oct 2021 7:49 #28389

In my sample program the smoothing mode is set to 5 in the main program and this value is used when calling draw_curvesD@.

At the moment you can't dynamically change the %pl smoothing mode by a call to set_smoothing_mode@ but I have made the necessary changes so that this call will work in the future.

draw_curvesD@ will provide smoothing even when you don't ask for it (mode = 0) so if you want no smoothing then you must call set_smoothing_mode@(3) which is also a no-smoothing mode.

In the following sample (which will work with the next release of ClearWin+) the default %pl smoothing mode is 5 but the curve is draw without smoothing.

      WINAPP
      MODULE mymod
      USE clrwin
      INTEGER,PARAMETER::N=11
      DOUBLE PRECISION x(N),y(N)
      CONTAINS
      INTEGER FUNCTION cb()
      CALL set_plot_mode@(1)
      CALL set_line_width@(4)
      is = set_smoothing_mode@(3)
      CALL draw_curvesD@(x,y,N,RGB@(0,0,255))      
      is = set_smoothing_mode@(is)
      CALL set_plot_mode@(0)
      cb = 2
      END FUNCTION
      END MODULE mymod
     
      PROGRAM main
      USE mymod
      INTEGER i
      DO i=1,N
        x(i)=0.1d0*(i-6)
        y(i)=x(i)*x(i)
      ENDDO
      i=winio@('%ca[Quadratic]%pv&')
      CALL winop@('%pl[title=Graph]')
      CALL winop@('%pl[y_max=0.25]')
      CALL winop@('%pl[x_array]')   
      CALL winop@('%pl[smoothing=5]')
      CALL winop@('%pl[link=user]') 
      CALL winop@('%pl[frame]')
      i=winio@('%^pl&',400,250,N,x,y,cb)
      i=winio@('%sf%ff%nl%cn%tt[OK]')
      END
27 Oct 2021 8:26 (Edited: 27 Oct 2021 9:17) #28390

Great, thanks Paul. One more small suggestion for potential improvement: when i exit the plot made with this new option set_plot_mode@(1) what happens is that, say, draw_line_betweenD@ is still performing plotting in this mode but plot is already destroyed before set_plot_mode@(0) is called at the end of its subroutine and i get crash with 'Error: The current drawing surface is not from %PL graph'

Things are that cancelling plots usually happens very many times per day without waiting when it finishes plotting (plotting may be performed by the running code automatically every second or so to catch specific moment).

Crashing in this case is crashing the entire code, not just this specific plot, and this is very painful experience. Would be great if such error message appeared without crash, it's OK to have such message but preferably that it disappear when you just touch it with the mouse (adding to message the %sv). I think conflict appears because there are many other %GR and %PL windows in regular mode (set_plot_mode@(0) ) still open when you cancel set_plot_mode@(1) plot

27 Oct 2021 8:47 #28391

Dan

This particular error message already provides a message box with the option to continue without raising an exception.

27 Oct 2021 9:15 #28392

Cool, thanks

17 Dec 2021 7:13 #28632

I had the following problem with new mode the example of which was shown by Paul as the first demo code in this thread. Somehow the draw_line_betweenD@ misses %PL window and when CWP detests that it allows to avoid the crash by offering an option (popped some window) to ignore the problem but when i click Ignore All, the code still stops in Debugger as an Error and i have to restart the program.

https://i.postimg.cc/VNKPLYYp/draw-line-between-D.jpg

I suspect this may happen because i use %lw at the end of the function which is opening %PL window (see the last picture above. I use %lw to allow other windows to be available during the run) so that when draw_line_betweenD@ starts numerous plots inside large DO loop, it sees other graphics windows as active ones in normal standard mode not in set_plot_mode (1). And when protection to avoid the crash kicks in to resolve the problem, it still somehow does not succeed

This is already part of large code and i can not extract the demo. May be this info is enough to suggest the solution to avoid this crash. Or may be some more strong protection could be possible to add to CWP so that draw_line_betweenD@ will ignore and do not crash when missing needed mode or even will not crash when there is no any graphics windows at all

17 Dec 2021 7:40 #28633

Dan

I would start by using clearwin_string@('CALLBACK_REASON') within the drawing function (if you are not doing so already). Find the 'reason' corresponding the required drawing and make this a condition...

IF(clearwin_string@('CALLBACK_REASON') == '....')THEN....

23 Jun 2022 4:59 #29090

hello, - i was just wondering around looking at posts and was attracted by the colourfulness of the last plot posted on page 1 - nice DanRight just one question - on the vertical scale, how can the exponent be raised up like on the first plot again on p.1 at the beggining - also i may have bad eyes but are those numbers centred on the marks on the axis or slightly shifted? - what's the procedure for positioning the values in a particular location relative to the ticks?

23 Jun 2022 5:08 #29091

ah-sorry, just spotted something else on the second graph- how is the variable number of decimal points specified for the alternate numbers again on the vertical axis ?

23 Jun 2022 10:48 #29094

Davey, 
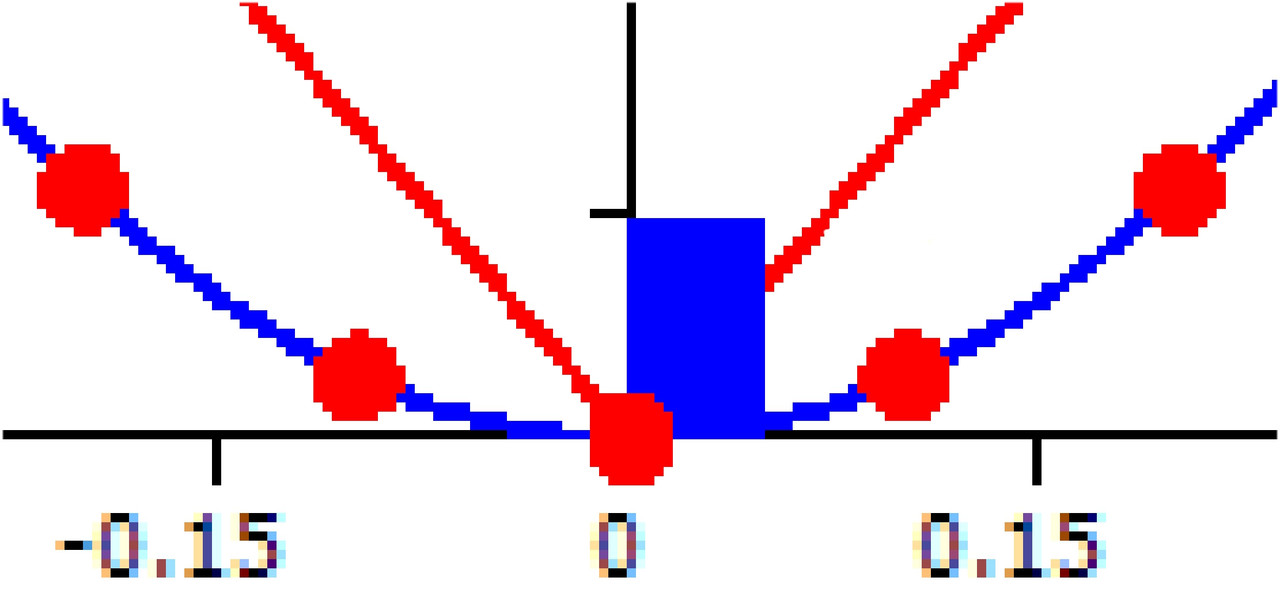
Do you mean exponent like here : cm-3 ? It can be done by shifting it (you also can scale the font a bit lower in size like this

	  call SELECT_FONT@('Tahoma') !  Courier New, Terminal etc
	  call scale_font@(FontSize1)
!	  call BOLD_FONT@( 1 )

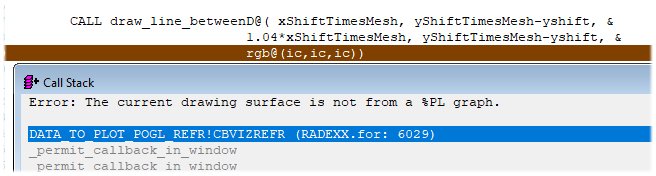
and then return size back for other needs. But here it was not have been done) by delta_X. For both draw_line_between or draw_line_betweenD this is done like this

CALL draw_line_betweenD@(x1+delta_X, y1, x2, y2, icolor )

though usually all small defects like that i ignore and just photoshop a bit later. Small editions always needed anyway here and there when you prepare the plot for high level publications. But better to keep the code as small and simple as possible because such subroutines will be reused many times in the future for different plots.

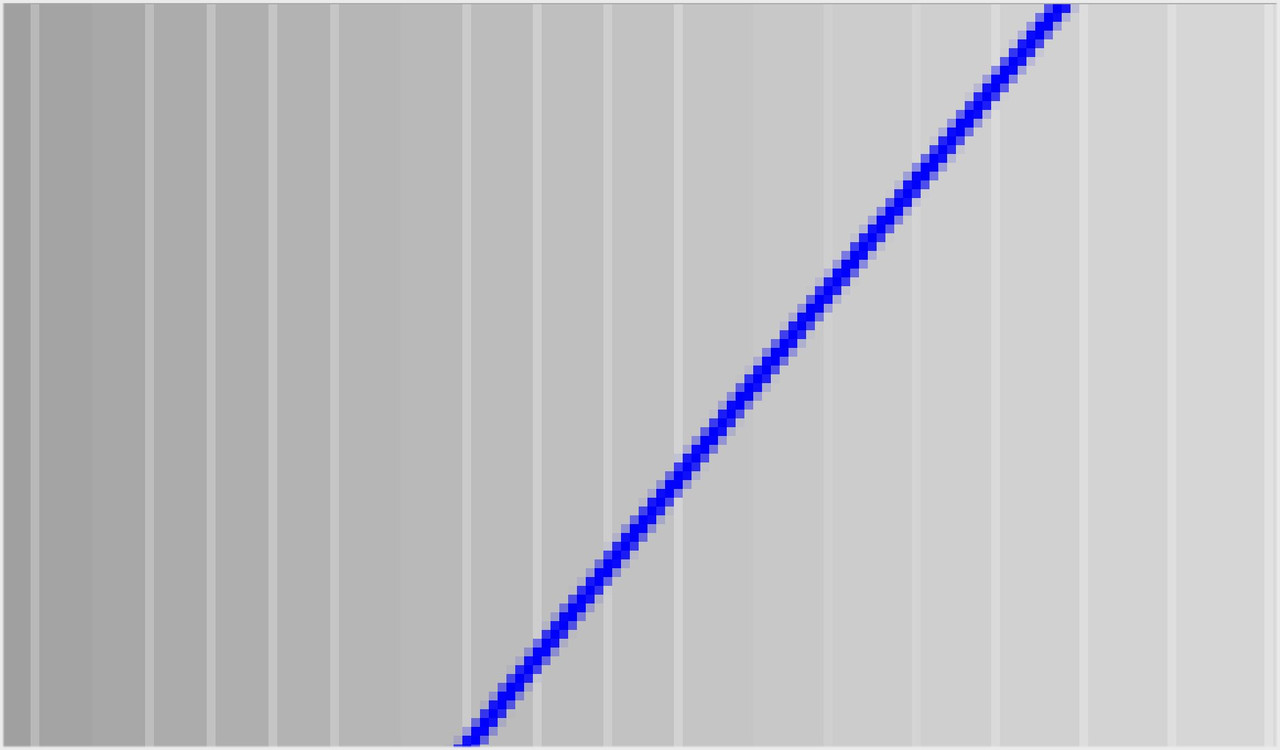
Yes, tics and numbers at the right of the plot are a bit shifted same way as above depending on the font size used. It is possible to make universal code which will correct that automatically if this is the most important plot of your code but usually you just setup the font and put adjustment parameters in special settings which can be called by your click any time later (for not to recompile the code every time).

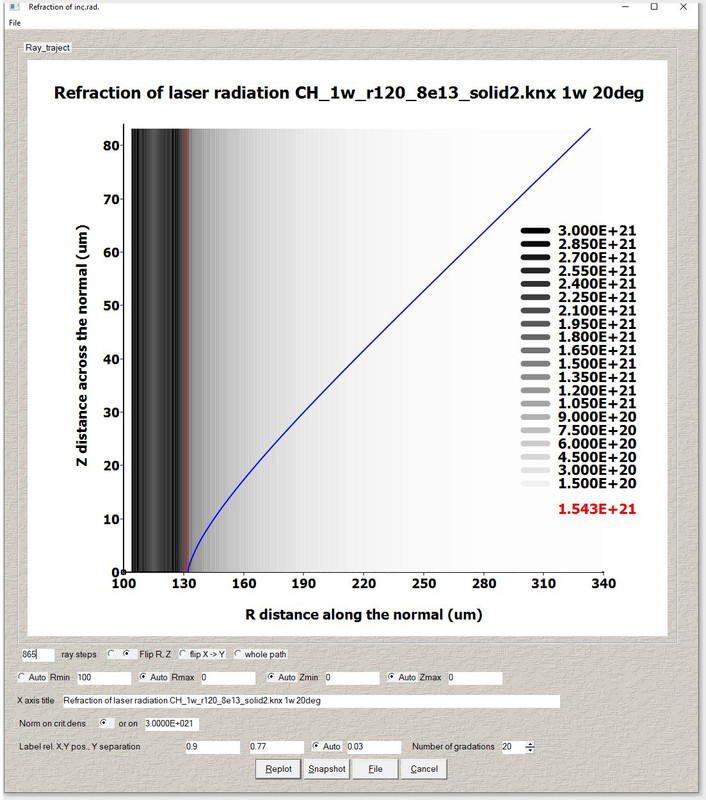
The number of decimal points in plotted numbers was supposed to be a recent addition to Clearwin, i do not remember if it was added. But probably you can do that in Designer's Mode settings. When we add just one line to your Fortran Clearwin source code specifying any name settings file

 CALL winop@('%pl[file=Multiplot01.set]') 

the DM will automatically appear like an icon in the upper left hand side corner and you will do a hell lot of things with the plot there - i currently always use Designers Mode in all of my plots. It already there in my demo code above, have you tried it? Thanks to Paul, besides adding native PL, this was one greatest simplification and improvement of Clearwin of recent years.

27 Apr 2023 12:39 #30229

If i do this, what is naturally expected, it does not work

        CALL draw_charactersD@(trim(SomeplotText1), 
     *  30+ixShiftTimesMesh+idx,                           ! bug ?
     *  iyShiftTimesMesh + i*idShiftTimesMesh+13.d0, 0)	

and if this - by using double precision pixel coordinate 30.d0 - it works

        CALL draw_charactersD@(trim(SomeplotText1), 
     *  30.d0+ixShiftTimesMesh+idx,                           ! bug ?
     *  iyShiftTimesMesh + i*idShiftTimesMesh+13.d0, 0)	

Strange...

27 Apr 2023 1:29 #30230

Dan,

Assuming the prefix i denotes default integer kind:

integer :: ixShiftTimesMesh = 10, idx = 1
print*, kind(30+ixShiftTimesMesh+idx)         ! KIND = 3 integer
print*, kind(30.d0+ixShiftTimesMesh+idx)      ! KIND = 2 real
end

Both coordinate arguments of draw_charactersD@ must be real, KIND=2 i.e. double precision.

The second coordinate in the argument list is already double precision due to the +13.d0

Ken

27 Apr 2023 1:50 #30231

Good judgments come from experience, experience comes from bad judgments. Now too much experience makes me bad judgments. Confusing is that previously in graphics library used for all that draw_characters@(ix,iy), draw_line_between@ etc were used integers to position on the screen. Which is now changed.

I made this error several times already. In a year or two i forget and make same error again

How Matlab does not care if this is integer or real ? Is this doable in Fortran ?

27 Apr 2023 2:33 #30232
!
! If you are going down the route of mixing real, and integer, and 
! different kinds for the arguments, perhaps you need something 
! like these, but there's a lot of type conversions going on.
!
  CALL draw_characters@(trim(SomeplotText1), &
    NINT(DBLE(30+ixShiftTimesMesh+idx)), &
    NINT(DBLE(iyShiftTimesMesh + i*idShiftTimesMesh+13.d0)), 0)
!
! or
!
  CALL draw_charactersD@(trim(SomeplotText1), &
    DBLE(30+ixShiftTimesMesh+idx), &
    DBLE(iyShiftTimesMesh + i*idShiftTimesMesh+13.d0), 0)
!
! or write your own generic wrapper function say draw_charactersDan
! in a module with appropriate module procedures defined for different 
! combinations of real/integer/kinds, which would make the fortran 
! code behave like Matlab
!
27 Apr 2023 5:39 #30233

draw_characters@ and draw_line_between@ have not changed. They still take integer co-ordinates.

Please login to reply.