Silverfrost Forums

Welcome to our forums

Dimension of %PL

28 Jun 2021 12:33 #28017

Dan

The next release of the DLLs contains fixes for:

  1. the multiple message box problem and

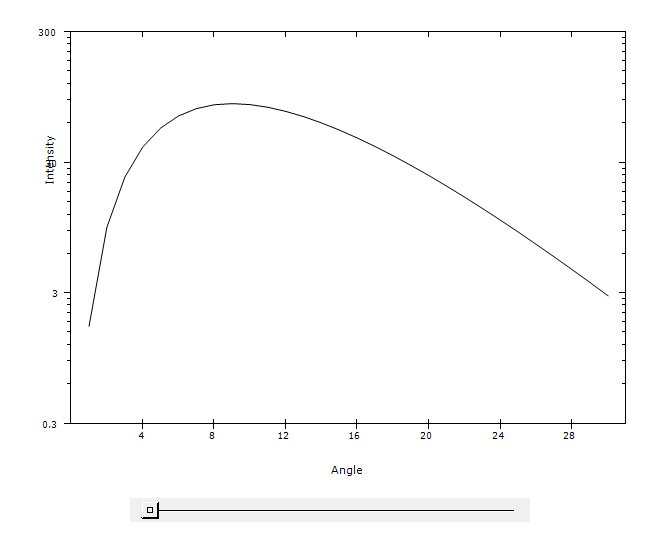
  2. the range failure on the logarithmic x axis.

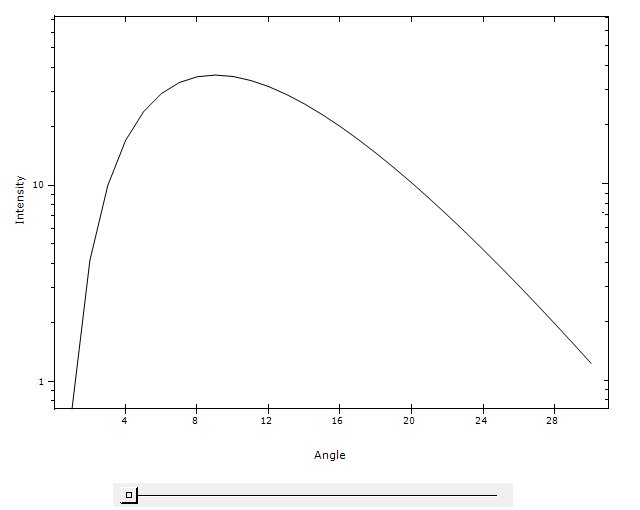
I have had a brief look at two other associated failures. In both cases my initial assessment is that the sample code pushes %pl beyond its current design limitations. When using logarithmic scales...

  1. in the slider sample, maybe %pl does not dynamically adjust the minimum and maximum values and

  2. CHANGE_PLOT_DBL@(0, 'x_max', 0, 1.0d6) may not work for logarithmic scales.

28 Jun 2021 4:11 #28020

Paul, Thanks for updates and fixes. Please look closer at slider. Being dynamically updatable of all controls is #1 necessity of any GUI. The older %pl was buggy, fonts ugly, misaligned, nothing customizable, restrictive, most needed functionality missed and it was crashing like crazy, but it worked with slider if you were lucky being within its limits of stability 😃

It looks like with new %PL the limits ARE updatable dynamically, just the moment of update is chosen incorrectly. Hope this is an easy fix

With new %PL it is important to check that even if the initial data is everywhere well defined the %PL plots different data which in most option cases is smoothed. As a result the plotted data can cross any of 4 axes and even go negative where LOG is undefined. In last case crossing zero line will immediately give an internal crash and the safety mechanism will switch to linear scales. Curves crossing axis is hopefully the last major current problem. Happens both in linear and LOG cases. I need to make an example. May be other %PL users will publish some small demo example? I published that here before but can not find easily.

4 Jul 2021 7:42 #28050
  1. One more problem which could be already fixed as it looks related to previous ones:

If in the Chart Editor try to shift all tick numbers to the left so that Y=1010, 1011, 1012 are not collide with the axis, the only what moves are numbers 10, 100 and 1000. The 104, ...., 10^12 do not move at all.

   module mod1
   use clrwin
   parameter (N=8)
   real*8 X(N), Y(N)
   Data X/1e2, 2e2, 1e3,  1e4, 2e4, 3e4,  4e4, 5e4/
   Data Y/1000, 6622, 8333, 11111, 171776, 1e9, 1.e12, 1.e11/
   save
   contains

   INTEGER FUNCTION redraw ()
!    CALL simpleplot_redraw@()
    CALL        plot_redraw@()
    redraw = 2
    end function redraw
   end module
!................................
   Program bug333
   use mod1

   i=winio@('%fn[Tahoma]%bf%ts&',2.d0)
   CALL winop@('%pl[gridlines]')
   call winop@('%pl[axes_pen=2,frame_pen=2,width=2,x_axis='X Axis Title',y_axis='Y Axis Title']')
   i=winio@('%ww%pv%pl[file=aaa.set,framed,link=lines,x_array,scale=log_log,N_GRAPHS=1,y_min=100.]%ff&', 925,700, n, X, Y)
   i=winio@('%sf%cn%^bt[Redraw]&', Redraw)
   i=winio@('%es')
   end
  1. Minor improvement clearly needed: to offer an options of always using numbers in scientific format like 10X with LOG scale. The mix of scientific 10X and so called engineering format 1, 10, 100, 1000 never looks nice and i'd claim never used in any graphics software
5 Jul 2021 5:53 #28053

Dan

I have noted your request.

6 Jul 2021 11:28 #28055

Dan

Item (1) has been fixed but this will not be in time for the pending full release.

For item (2) the existing options [x_sigfigs=v] and [y_sigfigs=v] can be used to control the exponent form on the x and y axes respectively.

8 Jul 2021 11:59 #28063

Thanks, Paul, in respond to your last post, fixing this annoying error with LOGs is good deal.

As to y_sigfigs i failed to suppress with it the appearance of 100, 1000 in the demo example above and get these numbers shown in the form of 102 and 103. Actually, i tried also slider example above with it with LOG and linear scales and have not succeeded to make it to have any difference.

By the way i do not see any acceptable LOG numbering form without 'good number' like y_min=0.1 which i removed from slider demo in the example below to show how it disastrously looks after that. LOG always have to chose and mark only good numbers.

module mod1
use clrwin
integer, parameter:: N=30
Real*8 X(N),Y(N), Slider
contains
integer function cbSlider()
do i=1,N
  X(i) = i
  Y(i) = Slider*X(i)**3 * exp(-X(i)/3)
enddo
 call simpleplot_redraw@
!call       plot_redraw@
cbSlider=2
end function

integer function sniffRGB()
sniffRGB=2
end function


end module
!.........................................................
winapp
use mod1

call winop@('%pl[file=zPlotSettings.set]')
call winop@('%pl[y_sigfigs=3]')
i=winio@('%pv%^pl[x_axis='Angle',y_axis='Intensity',framed,full_mouse_input,&
&n_graphs=1, x_array,scale=log_linear,link=lines]%ff&',740,540,N,X,Y, sniffRGB)

i=winio@('%cn%50^sl&', Slider, 1d0, 100d0, cbSlider)

i=winio@('%lw%es',ilw)

i=cbSlider()
!call simpleplot_redraw@

end
8 Jul 2021 1:07 #28064

Dan

Try [y_sigfigs=2] and [x_sigfigs=2].

8 Jul 2021 8:23 #28066

This is what the example above gives with y_sigfigs=2. What i do wrong as it is clearly a pure disaster? What these tic numbers tell anyone, why they were chosen? https://i.postimg.cc/MT0fzLhs/Image5.jpg

The only acceptable numbering when every tic is clear is when we use y_min=0.1, ensuring exactly an order of magnitude change with 'good' numbers, like here: https://i.postimg.cc/prYSYP3D/Image8.jpg

If you Google for example 'logarithmic plot' and see all the Pictures, 99.9% of all LOG plots are like that, LOG basically exist mostly to see order of magnitude changes with clear good numbers like 1, 10, 100, 1000 or 100, 101, 102, 103 as tic marks. Even the numbers like 2 or 3 etc like here are not used as major tic marks because it is not clear what minor tic marks are (i used y_min=0.3): https://i.postimg.cc/nr2JVKVb/Image10.jpg 
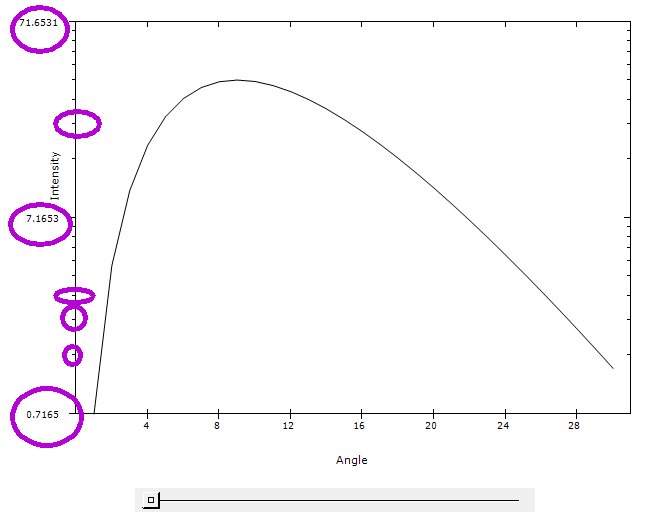
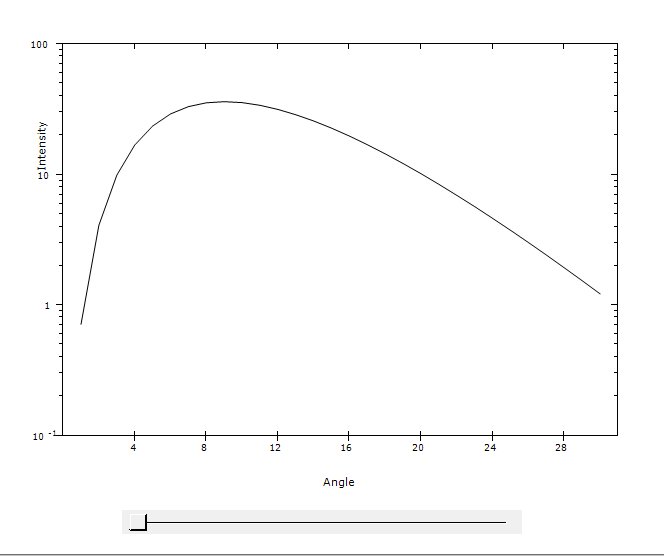
I understand why mechanism took 0.7165 - this is because the first Y number was 0.7165. But the tic numbering still has to be different, the ideal mechanism is working either like here below (i photoshopped this) or user by himself gives exactly an order of magnitude change with y_min=v with v is exactly 10^x https://i.postimg.cc/j5Ckrfg2/Image12.jpg

I am fine with using y_min=v where v is exactly 10^X but there is small bug somewhere in %PL, the slider example on first page of this thread showed that. It has to add another order of magnitude when the peak value reach approximately 0.8 of Y axis height, but it is doing that a bit too late

/** Funny, my computer crashed while i was writing this 😦(( Devilry

12 Jul 2021 6:42 #28077

Dan

I have noted your request.

22 Jul 2021 11:41 #28109

Dan

You get a better display if you use [y_sigfigs=1].

For me the y_axis caption moves as the slider is moved. I plan to investigate this fault.

Here is my adaptation of your code...

module mod1
use clrwin
integer, parameter:: N=30
Real*8 X(N),Y(N), Slider
contains
integer function cbSlider()
 do i=1,N
  X(i) = i
  Y(i) = Slider*X(i)**3*exp(-X(i)/3d0)
 enddo
 call simpleplot_redraw@
 cbSlider=2
end function
end module
!.........................................................
winapp
program main
use mod1
Slider = 1d0
i=cbSlider()
i=winio@('%es&')
call winop@('%pl[x_axis='Angle']')
call winop@('%pl[y_axis='Intensity']')
call winop@('%pl[framed]')
call winop@('%pl[x_array]')
call winop@('%pl[scale=log_linear]')
call winop@('%pl[y_sigfigs=1]')
i=winio@('%pv%pl&',740,540,N,X,Y)
i=winio@('%ff%cn%50^sl',Slider,1d0,100d0,cbSlider)
end program main
22 Jul 2021 3:29 #28110

This has now been fixed for the next release of ClearWin+.

24 Jul 2021 3:15 #28114

Great, thanks, Paul.

Please login to reply.