Silverfrost Forums

Welcome to our forums

Dimension of %PL

12 Jun 2021 10:41 (Edited: 13 Jun 2021 4:56) #27952

How to find x and y pixel size of %pl plot? When i resize the plot i need to save its parameters for next use. But if i add to callback this function

call get_graphical_resolution@(iXsize, iYsize)

to find the pixel dimensions then this gives me the entire graphics window sizes, not the sizes iXsize, iYsize which seems are used in the Native %PL

i=winio('%pv%pl', iXsize, iYsize, iDim, X, Y)

Looks like the plot area border sizes need to be included then both will be equal. But how to get border sizes?

13 Jun 2021 6:39 #27953

Try clearwin_info@('GRAPHICS_WIDTH') and clearwin_info@('GRAPHICS_DEPTH').

13 Jun 2021 4:51 #27954

Thanks, Paul, that works removing the need for border size knowledge.

Interesting is new experience with the new Designer %PL after i added just one single line to my previous %PL for this new %PL to handle my settings. That's all what is needed to turn old %PL to new %PL

CALL winop@('%pl[file=zPLsurfplot.set]')

Now we can adjust almost everything and do not worry about settings next time you start the program, the new Designer %PL will look at the file and adjust everything. It is that ultimate simplicity and convenience we were talking here for years: a half a line of text and professional quality plot is done, just adjust all you need without any programming

But one convenient thing is missing here.

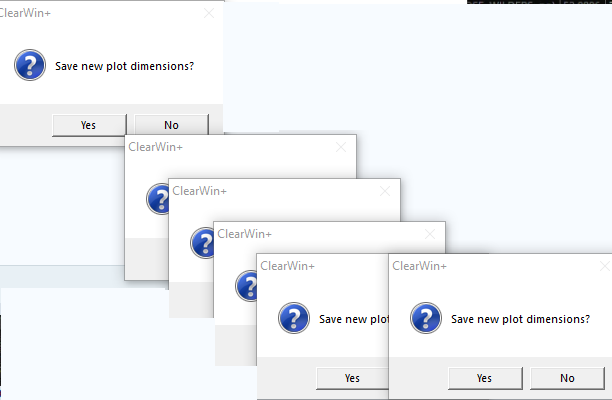
We have still to keep part of our own %PL plot settings because a lot more can be added by the user to the plot. Like additional plot captions, labels using different fonts, comments at specific places etc. But saving settings on resize now interferes with user older settings: the new Designer mode only saves changes when you edit the plot manually, while previously my own settings were saved automatically on each change in the plot. And user's settings saved after each resize are now ignored because Designer %PL takes plot sizes from its own settings.

Is it is doable to add an option to new Designer %PL which will allow automatically save its own settings on resize (when user adds %pv)? Introducing separate function callable by the user which will force %PL to save Designer's settings will also solve this problem

Another minor problem or feature request with Designer %PL is that if you set the limits on X or Y in Edit mode you can not unset them back to Auto. You need to go into the file (containing all these commas ,,,,,342,,,,,,4,,, 😃 ), find among commas your entries and delete them manually. Adding Auto options for all 4 limits will solve this problem

And totally miniscule request is to add ESC to exit from Designer's Edit mode

14 Jun 2021 3:41 #27955

Dan

I understand your request for the ESC action but let me take the other two requests separately.

If the design parameters are saved to a file using %pl[file=...] and if a user changes the size of the graph via the pivot but does not otherwise change the design then at the moment the new size is not saved.

I guess that you would like the new size to be automatically saved. Is that right? If it is, how would this be affected by the locked state %pl[locked]? and would there be a prompt to save?

Perhaps the best option would be to prompt to save but only when not locked.

14 Jun 2021 5:52 #27956

Paul, I have no opinion on [locked], did not use it before.

As to not locked case - i agree with your suggestion. I just may be add that would be great to give user the choose to confirm saving settings after plot resize or just quietly save the changes. All browsers for example quietly remember if you resize them. But giving user choice to confirm or not will satisfy all picky people 😃

14 Jun 2021 7:56 #27957

Dan

I have added this feature for the next release of ClearWin+.

It happened to be the easiest of the three. 'Adding Auto options' would require a big change for a small gain but maybe I will think of an easy way to do it.

Stange as it may seem, the 'miniscule' request happens to be the one that I don't know how implement in this context.

15 Jun 2021 6:36 #27959

Thanks for quick upgrade, Paul

19 Jun 2021 5:21 #27971

I checked how plot size is now updated with latest DLLs - all works good.

But in one case there is some problem.

This happens when i use callback with %^pl[full_mouse_input] to 'sniff' pixel color at cursor. In this case if after changing plot size i also go into editor and then exit it (the ESC works OK, by the way, thanks for workaround) and then exit plot i will be asked to close the plot many times in multiple windows which are generated by mouse cursor being in the surface area and due to that calling callback. Every time new window will be generated like this https://i.postimg.cc/nhS6WXvG/Size-Update.png

Looks like tricky case

19 Jun 2021 6:47 #27973

Dan

ESC will work when the listbox in the dialog has the focus.

If you can send me some sample code to illustate the multiple prompting then that would help.

19 Jun 2021 9:50 #27977

Yes, here is demo i took from our older posts in 2019 adding sniffRGB callback and full_mouse_input.

  1. No, ESC of plot editor works perfectly, thanks for adding it, as it was not easy you have mentioned before. This is minor feature but you really miss it when it is absent. Imagine to hit from first attempt hundreds times per day that tiny red cross in the corner of Editor window on 65' 8k monitor to close the editor window. This drops your self-esteem below the floor 😃 😃 😃 . And a loss of time ? Looks like tiny loss of 5-10 seconds but you are shooting this red cross totally whopping a half an hour a day ! So one bad day rebuilding some plot which peer reviewer did not like and trying to make plot perfect to satisfy him for sure i really exploded 😃

  2. To see the problem start the plot, resize it, go to plot editor, exit from plot editor with ESC, exit plot (ESC) and at that moment you will see the effect

  3. Please also look at the slider below the plot, there exist other small problem which needs fixing which is easy to see moving the slider

  4. Also i intentionally removed from that demo 2019 settings of line width, and frame width axes_pen=2, frame_pen=2, width=2 which to my opinion have to be default first time the %PL is opening ANY plots. This was to emphasie how bad looking plot with default settings. Current default axes_pen=1,frame_pen=1,width=1 makes very ugly plots. First impression is important. First time users may not touch the %PL second time.

  5. You may try changing simpleplot_redraw@ to plot_redraw@. This does not redraw the plot. Why?

    module mod1 use clrwin integer, parameter:: N=30 Real8 X(N),Y(N), Slider contains integer function cbSlider() do i=1,N X(i) = i Y(i) = SliderX(i)**3 * exp(-X(i)/3) enddo call simpleplot_redraw@ !call plot_redraw@ cbSlider=2 end function

    integer function sniffRGB() sniffRGB=2 end function

    end module !......................................................... winapp use mod1

    call winop@('%pl[file=zPlotSettings.set]') i=winio@('%pv%^pl[x_axis='Angle',y_axis='Intensity',framed,full_mouse_input,& &n_graphs=1, x_array,scale=log_linear, Y_min=1.e-1]%ff&',740,540,N,X,Y, sniffRGB)

    i=winio@('%cn%50^sl&', Slider, 1d0, 100d0, cbSlider)

    i=winio@('%lw%es',ilw)

    i=cbSlider() !call simpleplot_redraw@

    end

https://i.postimg.cc/7LR5w0XP/Image10.jpg

  1. There exist couple more small problems with %PL not related to previous ones. One of them is here. Aside from defect, notice how good this plot looks from first attempt with widths =2 compared to plot above with all widths=1. Earth and sky difference.

    module mod1
    use clrwin
    parameter (N=5)
    real*8 X(N), Y(N)
    Data X/1e1, 1e2, 1e3,  1e4, 4e5/
    Data Y/2.2, 66, 8333, 1111, 777/
    save
    contains
    
    INTEGER FUNCTION redraw () 
    

    ! CALL simpleplot_redraw@() CALL plot_redraw@() redraw = 2 end function redraw end module !................................ Program bug333 use mod1

    i=winio@('%fn[Tahoma]%bf%ts&',2.d0)
    CALL winop@('%pl[gridlines]')
    call winop@('%pl[axes_pen=2,frame_pen=2,width=2,x_axis='X Axis Title',y_axis='Y Axis Title']')
    i=winio@('%ww%pv%pl[native,framed,x_array,scale=log_log,N_GRAPHS=1]%ff&', 925,700, n, X, Y)
    i=winio@('%sf%cn%^bt[Redraw]&', Redraw)
    i=winio@('%es')
    end
    

https://i.postimg.cc/ZRnJ3Tfn/Xaxis.jpg

22 Jun 2021 5:45 #27989

I know Ken is using %PL. But interesting, JohnCampbell, Mecej4, Wahorder, JohnSilver, others, have you guys started actively using new %PL in your codes? Or you wait till all minor bugs will be fixed? Or may be you do not like something else?

22 Jun 2021 6:25 #27990

Dan,

I have modified your last example slightly. Clicking on the redraw button will now produce the required result. Note I am using CALL simpleplot_redraw@()

   module mod1
   use clrwin
   parameter (N=5)
   real*8 X(N), Y(N)
   Data X/1e1, 1e2, 1e3,  1e4, 4e5/
   Data Y/2.2, 66, 8333, 1111, 777/
   save
   contains

   INTEGER FUNCTION redraw ()
    i= CHANGE_PLOT_DBL@(0, 'x_max', 0, 1.0d6)
    CALL simpleplot_redraw@()
!    CALL plot_redraw@()
    redraw = 2
    end function redraw
   end module
!................................
   Program bug333
   use mod1

   i=winio@('%fn[Tahoma]%bf%ts&',2.d0)
   CALL winop@('%pl[gridlines]')
   call winop@('%pl[axes_pen=2,frame_pen=2,width=2,x_axis='X Axis Title',y_axis='Y Axis Title']')
   i=winio@('%ww%pv%pl[native,framed,x_array,scale=log_log,N_GRAPHS=1]%ff&', 925,700, n, X, Y)
   i=winio@('%sf%cn%^bt[Redraw]&', Redraw)
   i=winio@('%es')
   end
22 Jun 2021 8:48 #27992

Ken, Nice. May be this will give Paul more clues what wrong is there. I forgot to mention one more case, which was commented in my last example. Click this button several times. This behavior resembles the one of all politicians in the world: changing shoes in the air 😃

   module mod1
   use clrwin
   parameter (N=5)
   real*8 X(N), Y(N)
   Data X/1e1, 1e2, 1e3,  1e4, 4e5/
   Data Y/2.2, 66, 8333, 1111, 777/
   save
   contains

   INTEGER FUNCTION redraw ()
    CALL simpleplot_redraw@()
!    CALL        plot_redraw@()
    redraw = 2
    end function redraw
   end module
!................................
   Program bug333
   use mod1

   i=winio@('%fn[Tahoma]%bf%ts&',2.d0)
   CALL winop@('%pl[gridlines]')
   call winop@('%pl[axes_pen=2,frame_pen=2,width=2,x_axis='X Axis Title',y_axis='Y Axis Title']')
   i=winio@('%ww%pv%pl[native,framed,x_array,scale=log_log,N_GRAPHS=1]%ff&', 925,700, n, X, Y)
   i=winio@('%sf%cn%^bt[Redraw]&', Redraw)
   i=winio@('%es')
   end
23 Jun 2021 6:11 #27993

I will take a look at these samples soon.

24 Jun 2021 1:15 #27994

I don't use %pl. I find it interesting, as I do use plotting software for existing datasets, but it is not something I need in my existing code.

24 Jun 2021 5:43 #27995

Bill, Do anyone else use your software? Ask them if it is fun for them after using your code to finish the job in thirdparty software. They will tell you that ideally your own software has to do all the job, and preferably in one click

24 Jun 2021 12:14 #27996

Dan,

While I generally appreciate your comments, not this time. You made an incorrect assumption, and do not understand the nature of my SW product, the data the product ingests, nor the outputs the users receive and use in other applications.

I was not disparaging %pl or any other feature of FTN95/Clearwin. I just responded to your assumption that I should have used %pl in my commercial product. My comments on posts that are referencing %pl issues are very infrequent and my comments do not involve the internals/usage of %pl at all.

The 'existing data sets' I referred to in my comment happen to be personal, namely water level data from our church's water well being monitored for degradation from a nearby shopping center. I also have personally used plotting software (third party) when analyzing attendance data for a group; the curve fit capability of the software was useful in determining the general trend.

Were I to be producing commercial software to do the same kinds of work, %pl would be a great tool to use. In my personal case, using a third party piece of software (Kaleidagraph) suits my personal needs perfectly.

Bill

24 Jun 2021 3:16 (Edited: 25 Jun 2021 12:27) #27997

I think my assumption was not as far off 😃 I was not talking about your own preferences but preferences of your software potential users. Preferences of most of users of FTN95 i know: till they did not try, did not use seriously %PL they do not need it and do not like it. Human brain initially blocks everything new, and does not like extra work - this is a law of nature.

Users of our own software if they exist - this is different case. They need to learn how to use our codes and then learn how to use third-party software to finish the job essentially doing more job. Again human brain is rejecting extra work. If you combine two jobs in one and simplify to the limit users will be happier

Notice that for years i am making many simplest examples and pushing users to try? I am following the trick of sellers of white rats in pets markets. When people come into such market and see white rats their reaction is in 99.9% cases extremely negative. But if curiosity of some people stops them close to rat seller and they start asking questions ( a la if someone really buy these rats ?) the seller is doing the following trick: he drops the rat into their hands. Most people get shocked and then amazed how warm and cute these creatures actually are, that their prejudice was wrong, and many buy them. My goal is to have more users for developers to add new features faster as well as fix the bugs quicker

The benefits of %pl will notice only those who do a lot of visualization.

24 Jun 2021 6:24 (Edited: 25 Jun 2021 4:29) #27998

Dan probably does not find a good market for those white rats at the South Pole, where he claims to be, which may be why he is seeking to unload them on us!

25 Jun 2021 12:17 #27999

Fortraneers are much tougher than that. The %PL is little unique treasure made for the Fortran people. But you can not unload even 100 dollar bills on some of them 😃

Please login to reply.