Paul
That fixed style would be great
As to source examples and data I have emailed to you sources and data for LINEAR plotting. For the LOG plotting this example has all numbers set in the DATA and its pictures published few posts back
use clrwin
! parameter (N=5)
parameter (N=8)
real*8 X(N), Y(N)
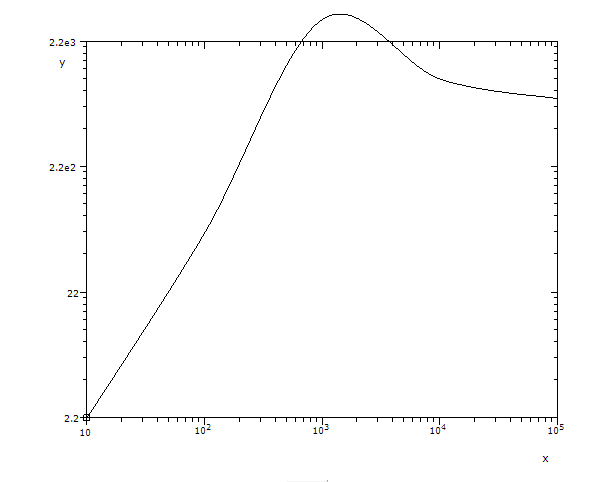
! Data X/1e1, 1e2, 1e3, 1e4, 1e5/
! Data Y/2.2, 66, 5555, 1111, 777/
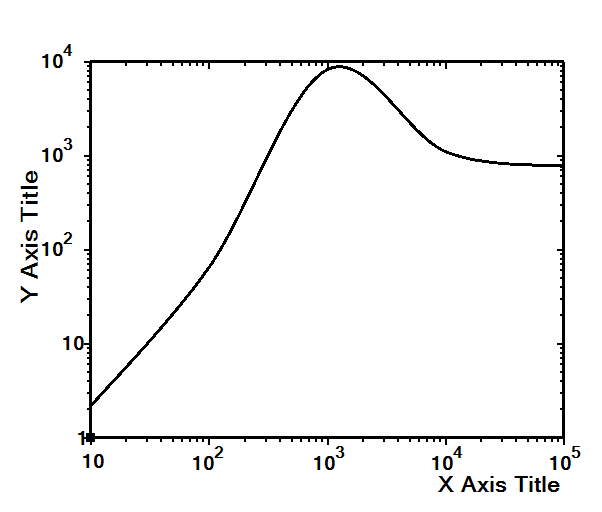
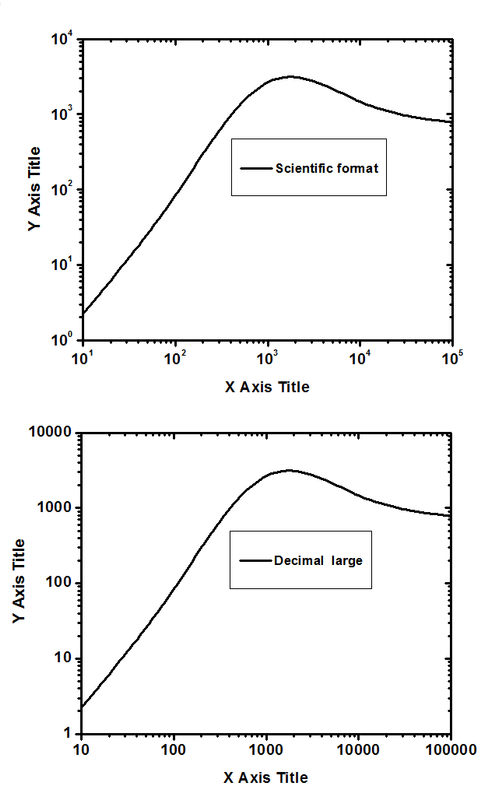
Data X/0.01,0.1,1,10, 100,1000,10000,100000/
Data Y/0.011,0.044,0.33,2.2,66,3333,1111,777/
i=winio@('%sf%ts%bf%es&', 2d0)
call winop@('%pl[axes_pen=3,width=3,x_axis='X Axis Title',y_axis='Y Axis Title']')
i=winio@('%ww%pv%pl[native,framed,x_array,scale=log_log,N_GRAPHS=1]', 625,500, n, X, Y)
end
and this example (discussed in CONTINUE2 above and the pictures are posted there too) also does not need external files, it creates data by itself
   WINAPP
    MODULE modd
    USE clrwin
    INTEGER,PARAMETER::N=65
    REAL*8 X(N),Y(N),Z(N),T(N), U(N)
    !.....................................
    CONTAINS
    !.....................................
    INTEGER FUNCTION callb()
    REAL(2) random
    DO i=1,N
      X(i)=i
      Y(i)=exp(0.35*i) * random()
      T(i)=Y(i)
      Z(i)=exp(0.7*i) * (random()-0.003)
      U(i)=Z(i)
    ENDDO
    CALL SIMPLEPLOT_REDRAW@
    callb = 2
    END FUNCTION
    END MODULE

    !.....................................
    PROGRAM KKK
    USE modd

    j=callb()
    i=winio@('%ww&')
    CALL winop@('%pl[native]')
!    CALL winop@('%pl[title='Log_linear@(115,299)']')
    CALL winop@('%pl[title='Title: ideal log_linear@(-15,10)']')
    CALL winop@('%pl[x_array]')
    CALL winop@('%pl[scale=log_linear]')
!    CALL winop@('%pl[y_min=.3]')
    CALL winop@('%pl[y_max=1e7]')
    CALL winop@('%pl[N_GRAPHS=4]')
    call winop@('%pl[framed]')
    CALL winop@('%pl[tick_len=10]')
    CALL winop@('%pl[axes_pen=4]')
    CALL winop@('%pl[x_axis='Wavelength (A)@(-202,2)']')
    CALL winop@('%pl[y_axis='Intensity (arb.units)@(-20,-222)']')

 !  i=winio@('%fn[Tahoma]&')  ! Verdana
    i=winio@('%sf&')
    i=winio@('%ts&', 2.2d0)
    i=winio@('%tc&',rgb@(0,0,0))
    i=winio@('%bf&')

    CALL winop@('%pl[width=3]')
    CALL winop@('%pl[colour=red,link=none,symbol=7]')
    CALL winop@('%pl[colour=blue,link=none,symbol=9]')
    CALL winop@('%pl[symbol_size=8.]')
    CALL winop@('%pl[colour=black]')
    CALL winop@('%pl[colour=green]')
    i=winio@('%pv%pl&', 700,570, N, X,Y,Z,T,U)
    i=winio@('%ac[Ctrl+Z]&',callb)
    i=winio@('%sf%ts&', 1.d0)
    i=winio@('%ff%cn%^bt[Redraw]%es',callb)
    END
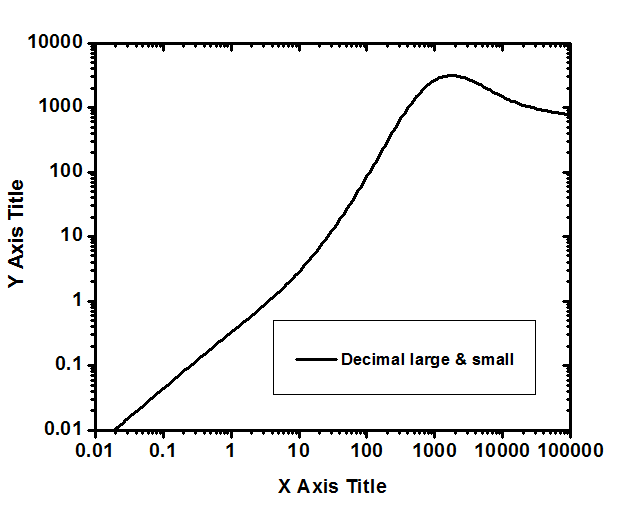 and if even more then 1e-3, 1e-4 ...
