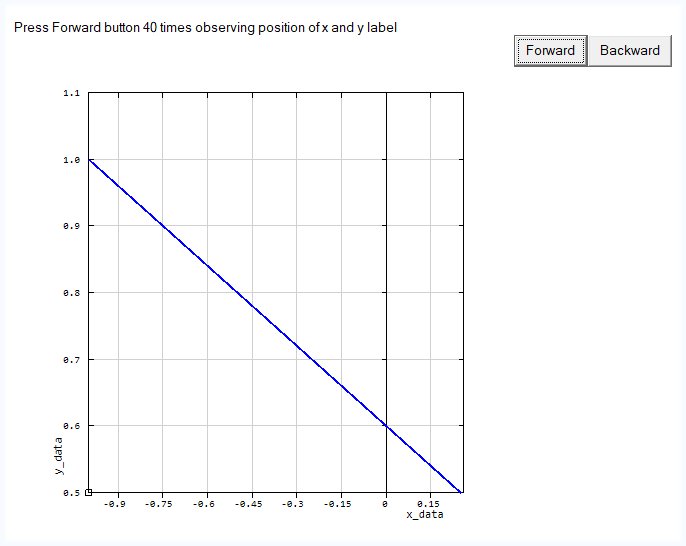
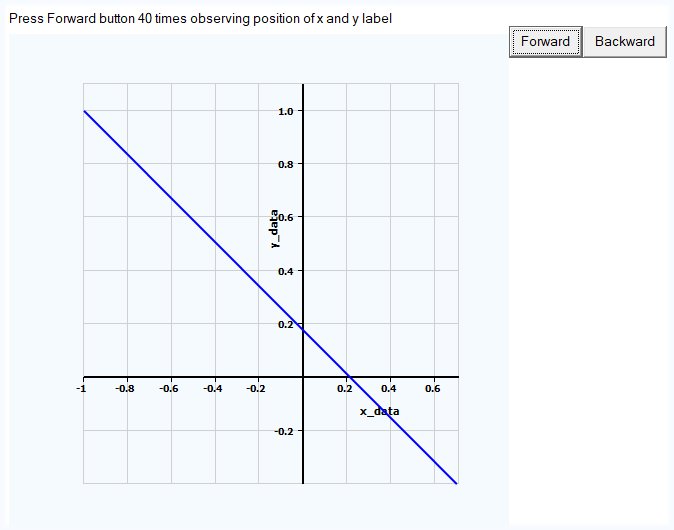
While I understand the existing algorithm used to determine the position of the x- and y-axis labels, for general purpose x/y plotting purposes it can result in very poor positioning of the x- and y-axis labels. The code below demonstrates the issue.
While this can be fixed by the programmer via a call back function to draw the labels after the %pl is drawn, a better approach (particularly for those starting to use %pl) would be an additional %pl option, with disables the default mechanism for label positioning and simply places the x-axis label centered on the centre line of the %pl frame and similarly for the y-axis label (similar to excel for example).
This would enhance the overall appeal of %pl for new users, and in my case, allow the simplification of new code.
This is the only remaining issue with the %pl[native] which I seem to run up against on a fairly regular basis.
Perhaps this proposed new option could be considered for a future update?
The direct link to the Clearwin+ enhancements file in the most recent version of Plato was a very good idea. I am finding that very useful.
module m
use clrwin
implicit none
real*8 :: x(2) = [-1.d0,1.d0],y(2) = [1.d0,-1.d0]
contains

  integer function gui()
  integer i
  i = winio@('%mn[Exit]&','Exit')
  i = winio@('Press Forward button 40 times observing position of x and y label&')
  call winop@('%pl[native,x_array,x_axis='x_data',y_axis='y_data', gridlines,frame,colour=blue,width=2]')
  i = winio@('%nl%fn[Consolas]%pl&',500,500,2,x,y)
  i = winio@('%sf%^bt[Forward]&',  forward)
  i = winio@('%^bt[Backward]&', backward)
  i = winio@(' ')
  gui = 2
  end function gui

  integer function forward()
    x(2) = x(2) - 0.05d0 + epsilon(1.0)
    y(2) = y(2) + 0.1d0  + epsilon(1.0)
    call simpleplot_redraw@()
    forward = 2
  end function forward

  integer function backward()
    x(2) = x(2) + 0.05d0 + epsilon(1.0)
    y(2) = y(2) - 0.1d0  + epsilon(1.0)
    call simpleplot_redraw@()
    backward = 2
  end function backward

end module m

program main
use m, only : gui
implicit none
integer i
i =gui()
end program main
 Good that positions and other settings could be adjusted if use Designer Mode, all this can done after plotting without programming, just clicking. I added into the source antialiasing and other things but this actually is not needed because can be done in Designer mode. For all other users who are interested this is the code and how plot captions could look after moving them using Designer mode:
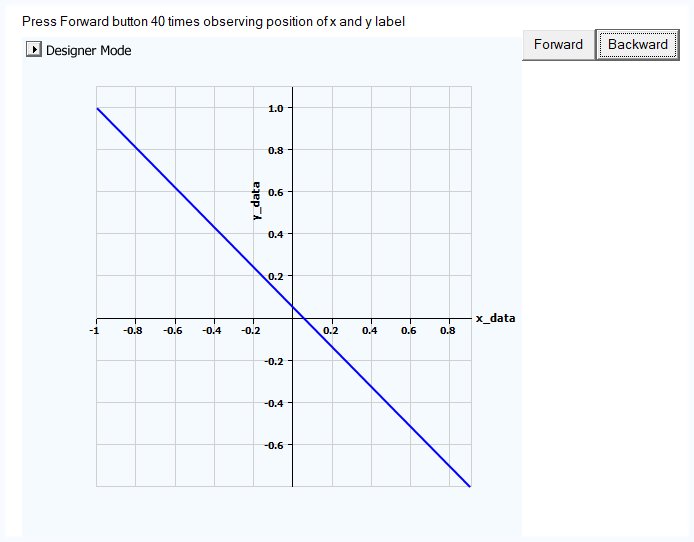
 Here you can click 40 times or 40000 times the result will look perfect. As another confirmation for that if you click on Ken's example Forward and Backward buttons the current placement in the middle of the positive part will look extremely ugly until it will be absolutely unacceptable aesthetically, permanently moving and at some point completely disappear: