Silverfrost Forums

Welcome to our forums

Location a value in one dimensional vector and its display

18 Feb 2021 10:53 #27111

Hello,

I have several 1000 points irregularly distributed in a graph (with their x,y coordinates) which have also a height information contained in an input file (in fact, the input file from which were the points read in and drawn in the graph has 3 columns - first column contains X-coordinate, second one Y-coordinate and the third one height values.

I wrote to a binary file only height values for possible identification when searching in the bin file and I would need to display the right height values on the corresponding point in the graph when pointing with the cursor over a point in the graph from that one-dimensional vector written in the bin file.

Is there a function (something like location in i,j table) which could be used for this purpose?

Thanks for any advise.

Martin

19 Feb 2021 12:28 #27112

Nearest neighbour weighted interpolation. This would allow you construct a regular x,y grid with interpolated z data.

19 Feb 2021 8:16 #27113

I am not sure if this is relevant but there are two routines that can be used with %pl, get_plot_point@ and get_plot_data@.

get_plot_point@ can be called from within a %pl callback function in order to get the pixel coordinates of a particular point relative to the axes.

get_plot_data@ is effectively the inverse of get_plot_point@.

These are documented in ftn95.chm and in the Clearwin+ enhancements file cwplus.enh.

19 Feb 2021 9:21 #27114

..and on the website: https://www.silverfrost.com/ftn95-help/clearwinp/simplepl/native.aspx

19 Feb 2021 10:31 #27115

Thanks to all for tips.

However, probably I did not explain it correctly what I want. I use all of the CLRWIN+ functionalities as Paul and Robert suggested. This is no problem and it works.

I need to show the height value on the corresponding point when hovering with the cursor over the point (the same like this):

https://i.postimg.cc/PxXDYS1J/grid-SGF.jpg

So, instead of the values DX,DY would be shown only H (height) value there.

BUT, I have a cloud of points in the graph, which are irregularly distributed in the graph, since they coming from a surveying in the field and it looks as follows:

https://i.postimg.cc/DypdP3zG/MM.jpg

The red points are points which form some lines and they have NO height information. The blue points are - in fact - surveyed points in the field and they HAVE the height information. So, for the blue points I would need to display the height info when pointing cursor over a blue point (like in first picture).

The input file containing the blue points, which I read in, is a TXT file containing the X,Y,H coordinates. During the reading in the file I created a binary file containing ONLY height information (although I could add there also X,Y). So, in fact, the BIN file is a one-dimensional vector from which I would like to extract the right height information and display it when pointing the cursor over a blue point and to this point must be extracted the right height value from the BIN file. I do not need to do interpolation.

For me is unclear, how to form a matrix (from one dimensional vector) and use there the function LOCATE_I_J_IN_TABLE (which successfully works in any matrix NxM) to extract a correct corresponding height value for the blue point when hovering over it in the graph.

This is my problem/question.

Thanks!

19 Feb 2021 12:26 #27118

It is unfortunate that the x, y data is not a uniform grid which is a prerequisite for LOCATE_I_J_IN_TABLE.

If the data was organised as x, y, z columns with i rows, for a given point xa, ya, for each row in turn calculate the Euclidean distance between (xi,yi) and (xa,ya) recording the minimum value of distance encountered so far and its corresponding i value. At the end of this process if the recorded distance is sufficiently small, you know the row i which contains the required z information. If the recorded distance remains large then you know you are not pointing to a real data point. Rather a brute force approach, which could be slow.

You could speed the process up by preprocessing the input data into a more organised form, for example dividing the initial ordering of the row data into N strips across the plane and record the starting and ending row/position of each strip, so that the search is limited to a subset of the data. If necessary the strips could be divided into squares……………

19 Feb 2021 12:46 #27119

Thanks Ken!

Really hard work.

I got the idea that I re-organize and re-write the ONE-dimensional bin file to a matrix with the dimension NxN (N = number of points with height info) and place the height info ONLY on the diagonal which also corresponds the reality since only X,Y pair with the same index (when I=J) have real height values, any other combinations (with different I,J have NO height values.

So - for example - in case of Matrix 4x4 it would have the following form (where H1 ... H4 are height values):

 Y1    Y2   Y3  Y4  

X1 H1 0 0 0

X2 0 H2 0 0

X3 0 0 H3 0

Y4 0 0 0 H4

So, only point pairs with the same index would have height values - it means, ONLY when I=J, any other I,J combination would equal 0.

Although - to be honest, I doubt whether it is right direction.

19 Feb 2021 1:40 #27120

Well, Martin, in effect you erased/hid the very data that you need to do the job when you decided to put only the height data into the binary data file. Instead, you could have chosen to save the X and Y coordinates of the plotted points (which would be rounded approximations to the field x, y data) along with H. You can keep the binary file sorted with X as the first key and Y as the second key.

When the mouse is placed over a plot point, Clearwin gives your program the X and Y values of the point; with those two values, you search the sorted table using, say, binary search, to find the corresponding H, and then display that value at the cursor location.

19 Feb 2021 9:48 #27126

Thanks for your hint Mecej4!

My idea with a matrix fulfilled with values on the diagonal (P(i,j), where i=j) whereas all other P(i,j) positions would be equal 0 is hardly practically feasible. Taking into account a Matrix of about 7000x7000 with record length of 8 bytes means 7000x7000x8 bytes what represents extremely huge number of bytes.

So, I will try your suggestion!

Martin

19 Feb 2021 11:55 #27127

This may be of some help. While I am sure the algorithm can be improved (and there are others who know more about these things than I do), you might like the use of %th to display the height information.

https://www.dropbox.com/s/sbd3ff05q03cni6/show_ht_with_tooltips.f95?dl=0

20 Feb 2021 2:12 #27135

Many thanks Ken!

I will try to implement it later, since I am under the pressure with another thing now, which must be finished ASAP! Your code is complex and precise

  • thanks again!

But, I thought about Mecej4 idea, tried it to simplify and I got (during last night) an additional idea. NOTE: all code is written in a MODULE except some lines in the MAIN program.

First, I abandoned the idea to write something into a BIN file. Instead, in a subroutine which reads in the whole data set from the field (points with PointID,Y,X,H values) in a DO loop, I added INTEGER allocatable variables for the purpose of comparison of real field data coordinates with pixel coordinates transformed to real coordinates as follows:

...
		body_mm: do v = 1,L

			read (9,15)  riadok_mm(v)
15			format(a)

			read(riadok_mm(v),*)point_id_mm(v), y_mm(v), x_mm(v), h_mm(v)

            y_mm(v) = y_mm(v) * (-1.0d0)
            x_mm(v) = x_mm(v) * (-1.0d0)

			y_mm_i(v) = nint(y_mm(v))
            x_mm_i(v) = nint(x_mm(v))

        end do body_mm

            rewind (9)

....

I used the NINT function to have both real field data points and real pixel coordinates as INTEGERS for subsequent comparison test.

In the call-back PL_CB which is invoked at the line '%`^pl[full_mouse_input]&',gw,gh,npoints,y_ok,x_ok,y_mm,x_mm,handle_pl_mm,pl_cb)

AFTER the 3 directives

....
ylp = CLEARWIN_INFO@('GRAPHICS_MOUSE_X') ; xlp = CLEARWIN_INFO@('GRAPHICS_MOUSE_Y')
 i = GET_PLOT_DATA@(ylp,xlp,ylr,xlr)
write (output_string(1),fmt(1)) ylr,',',xlr

I put the following code:

						ylr_i = nint(ylr); xlr_i = nint(xlr)

terenne_suradnice_vs_pixelove_suradnice:	DO v = 1,L                                            

IF (ylr_i == y_mm_i(v) .and. xlr_i == x_mm_i(v)) then
     write (output_string(3), fmt(2))'H= ',H_MM(v) ! Do pravouholnika v grafike sa vypise hodnota H_MM v zmysle formatu FMT(2)                                                            

END IF
END DO terenne_suradnice_vs_pixelove_suradnice   
...

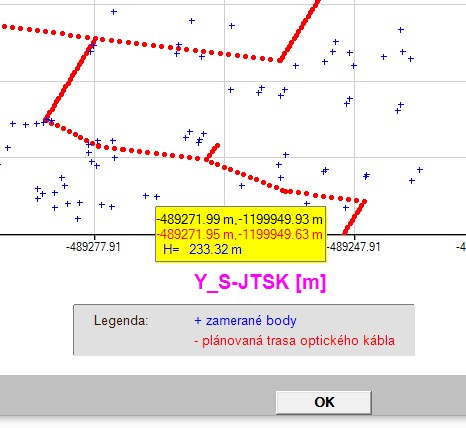
The result can be seen here:

https://i.postimg.cc/52XRKf3Z/vyska.jpg

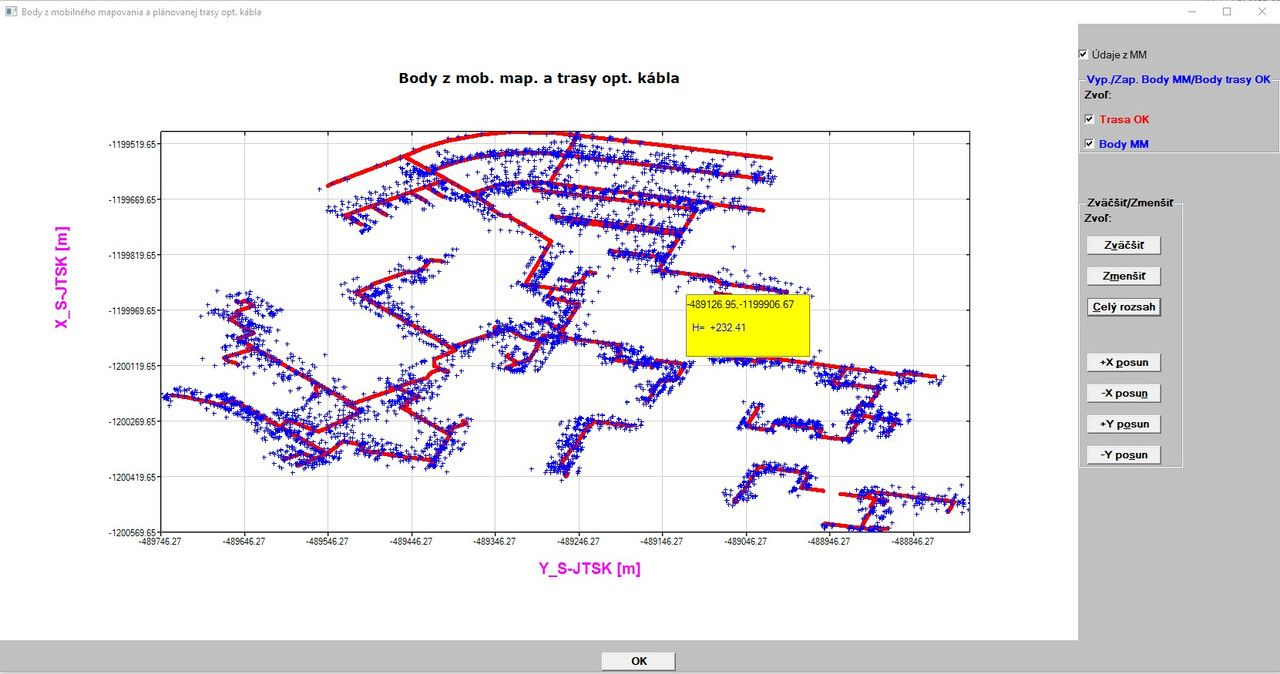
However, this approach has two shortcomings - one minor (negligible), the other a little bit more serious.

The minor problem is, when I move with the mouse outside the graph, after moving back to the graph area - instead of a height value value there are some unreadable charcters displayed which quickly change back to a height value, as soon as the cursor starts moving over blue points. To avoid this, it is necessary not to move outside the graph area.

A little bit more serious problem stems (at least I suppose so) with the use of function NINT and with the precise clicking of the cursor. 
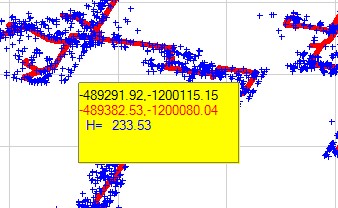
I compared the displayed HEIGHT value and horizontal coordinates with the source TXT file from which the field data were read in. The HEIGHT value is OK, but horizontal coordinates are NOT exactly the same in the display box as in the source TXT file (they differ) sometimes very little, sometimes more (1-3 meters).

I could post full source code of the module and main program along with necessary 3 input TXT files along with RCX file (since part of the main menu was created in the designer %wi) and JPG file (logo).

During the development I got some ideas to enhance/improve the %PL options. I will post it soon under ClearWin+ topic.

Thanks for potential comments!

Martin

20 Feb 2021 5:18 #27137

Additional info to my preceding post:

I solved the problem with the display of not quite 'precise' coordinates.

I also added the code to display the real coordinates from the field in the yellow box which are read in from a TXT input file (in the box they are in red color - see picture below):

https://i.postimg.cc/TPV9QvC6/H-DOBRA-upravena.jpg

I checked the point with source data - and EVERYTHING is correct, both horizontal coordinates and also height value, there are absolutely NO differences.

What newly appeared is a strange effect (the unreadable marks (underlined red in the picture above). I do not know, why they appear.

The output string for the output of X,Y,H values is as follows:

...
CHARACTER(len=256) output_string(4), CLEARWIN_STRING@
character(len=22), parameter :: fmt(1:2)=(/'(SP,F10.2,1A,F11.2)   ','(SP,2X,A3,1X,F5.2)    '/)
...

Has anybody an idea why such signs appear?

Moreover, here I encountered a practical problem. When I checked whether all displayed data in the yellow box are the same as in the input TXT file, I found that in the input there are several points (among about 7000 points) with the same HEIGHT value. And this adds another reason to enhance the %PL options. Again, I will discuss it in more details in a new post in the CLRWIN+ section.

20 Feb 2021 6:26 #27140

The relatively new %dl format code can be used in interesting ways with %pl.

https://www.dropbox.com/s/f5cnnnwfaiknqku/show_ht_with_tooltips_2.f95?dl=0

20 Feb 2021 9:22 #27141

Thanks Ken!

I will have a look at this.

Finally, I removed the problem with the unreadable signs at the line displaying the heght values, although - to be honest - I do not understand why they appeared (the unreadable signs).

Now - it looks like this:

https://i.postimg.cc/3w996LL6/H-string-OK.jpg

The solution was that I shortened the string length for the H values in the output declaration of length string from 256 characters to only 40 characters.

 CHARACTER(len=40) output_string(3)

Nevertheless , it does not explain me, why - when using the 256 characters buffer length - why there were displayed the unreadable signs. I thought that when the character length is very long and is not fully used, the remaining place for potential characters will be fulfilled with blank spaces. Apparently, in this case it was not so and this remains for me unclear - why.

Thanks again for your valuable help, Ken!

Last question (at least I hope so) in this context:

Is there a SNAP option/function in FTN95 (to snap the cursor to the point in the graphic area within an aperture) which would have the user defined and changeable dimensions (the aperture)?

Martin

23 Feb 2021 1:38 #27158

Martin,

Here is my final offering.

Select a data point with a left mouse click. This will display X,Y,Z data at that point using tooltips. The current selection must be deselected by a right mouse click. This avoids using the %pl[full_mouse_input] option with its continuously calling of the %pl callback.

The new %pl[vscroll,hscroll] options are used to pan across the plot using scroll bars. An additional scrollbar provides a zoom function. (Note: the coordinate transforms need revisiting, this was a first hack.)

All updates to the %pl region are performed by the %dl timed call back. Simpleplot_redraw@ is only called when a change is detected, otherwise the timed call back simply returns. This is the reason for the saved variables in the %dl callback.

Paul,

The only real problem I can see, is that when the %pl[vscroll,hscroll] options are used, a small coloured square appears external to the bottom right corner of the %pl region.

https://www.dropbox.com/s/xhk84qfv2orjkkw/pl_scroll_zoom_th.f95?dl=0

23 Feb 2021 4:01 #27159

Ken

Thanks for the feedback.

I have tested your program and I can see the unwanted tooltip when using the scrollbar.

Before trying to find a fix, I would like to be sure that I have it working correctly. Initially I can click on the graph and the point is marked and a tooltip appears but another click does not move the marker and the tooltip does not reappear (except when hovering over the scrollbar). Does it behave in the same way for you?

23 Feb 2021 6:42 #27161

Many thanks Ken!

I am going to implement it. My approach with the DO loop (as it seems ) is not the right way, since it always produce the run-time when I try to display the Point ID in the showing box.

23 Feb 2021 7:18 #27162

Paul,

I just tried Ken´s program and it works. First, I selected a point with left click on a point the data are displayed. The I deselected the selection by right clicking and selected another point with left click and it displayed again the required values and so on.

23 Feb 2021 8:02 #27163

Ken,

I just became aware that I have an essential problem with displaying Point ID (Point name) in the showing rectangle (not with the height value - although I had to use strict limitations for displaying of Height values, but - basically it works as can be seen in the picture below):

https://i.postimg.cc/d03Y04cn/Legenda.jpg

The input file has the following format (an example):

Point Id Y coordinate X coordinate Height A-12 -485032.33 -1232457.87 234.26 135 -485043.25 -1232465.57 233.99 ... and so on.

When I read in the whole input file, I have in the program memory the four vectors: PointID(n), Y(n), X(n), H(n).

Can I also display the POINT ID with your approach?

I mean - in the showing box should appear the following values (for example):

A-12 -485032.33 -1232457.87
234.26

I believe so, please confirm - thanks.

23 Feb 2021 9:44 #27164

Paul,

Before trying to find a fix, I would like to be sure that I have it working correctly. Initially I can click on the graph and the point is marked and a tooltip appears but another click does not move the marker and the tooltip does not reappear (except when hovering over the scrollbar). Does it behave in the same way for you?

Yes, a second left click does not move the marker as a right click is required to cancel the current selection. Having repeated your list of “moves” a few times, I realise there is a flaw in the logic in the call back function which causes the current tooltip help information to be lost (following a second left click) when a point is currently selected. I’ve now corrected that.

!    Display height at point
    if ( clearwin_string@('callback_reason') .eq. 'MOUSE_LEFT_CLICK') then      
      call SET_TOOLTIP_TEXT@(pl_handle,'')
      if (show_height_flag .eq. 1 ) then

should be:

!    Display height at point
    if ( clearwin_string@('callback_reason') .eq. 'MOUSE_LEFT_CLICK') then      
      if (.not. point_selected) call SET_TOOLTIP_TEXT@(pl_handle,'')
      if (show_height_flag .eq. 1 ) then

You may have noticed that a blank tooptips help appears when hovering over the %pl region before any data points are selected. This is due to the initial declaration of the help_string containing char(10). I fixed this by adding the following to the timer call back function, so the char(10) is removed within 0.5 s of the window being created.

  logical, save :: first = .true.
  
    if (first) then
      call SET_TOOLTIP_TEXT@(pl_handle,'')
      first = .false.
    end if

With these changes, when the user selects a point the coordinate data is displayed next to the point where the click occurred (if there is a data point in the vicinity).

After the tooltips vanishes, the only way to recover the information is to move completely off the %pl region and back into it, the tooltips reappears where the mouse stops. This is not a problem and is consistent with the documentation.

Also, after the tooltips vanishes, if the user moves the mouse from the graphics region to the slider no tooltips appear. However if the user moves beyond the slider (away from the %pl) and then back onto the slider – then the tooltip appears on the slider – which is a little misleading, but not really a major issue. As you said an “unwanted tooltip”.

Modified code can be found here:- https://www.dropbox.com/s/lqxafs188nlic4d/pl_scroll_zoom_th_2.f95?dl=0

Can you see the small coloured square that appears external to the bottom right corner of the %pl region ? https://www.dropbox.com/s/v2l5g8oc06byicb/pl.jpg?dl=0

A long post. I hope this description is clear - I can resort to a video if necessary.

I am using the DLLs you provided on the 4th January (that fixed an issue with %`fl with [height] and [vertical_fill] option)

Thanks

Ken

Please login to reply.