Thanks John,
That was another good hack! It now allows to run programs simultaneously. Multiple instances of same program are routinely running on my computer. Or just stay till i realize their results. It's like having multiple tabs in the browser.
And the advice of negative fonts was also good, i found the font which looks nice, but unfortunately it is italic. Italic layout hides pixelation of straight fonts.
Playing with Hershey rised the following obvious question:
do any antialised Hershey fonts exist in the nature? Why not, what's the problem? That would deliver high quality texts. There also exist a chance that on 4K monitors Hersheys will look without visible defects -- can anyone who has the latest tech try this source below on 4K monitors?
Here is the code for selection of best looking fonts/widths/charsets
!--------------------------------------------------------------------
! Compilation:
!
!ftn95 aaa.for /free /debug /undef
!slink aaa.obj 'c:\\Program Files (x86)\\Silverfrost\\FTN95\\SIMPLE.DLL'
!
! With thanks to Agustin 'Aebolzan' and John 'John-Silver'
! of the Fortran forum forums.silverfrost.com
! for bringing almost dead Simpleplot to life
!-------------------------------------------------------------------
Program simple
integer, external :: ActualPlotting
real*8 TextSize
integer LineWidth, iCharacterSetNo
common /aaa/TextSize, LineWidth, iCharacterSetNo, LWindow
TextSize = 0.41
LineWidth = 4
iCharacterSetNo=-11
i=winio@('%ww&')
i=winio@('%1tl&',16)
i=winio@('%sp&',200,250)
i=winio@('Text size %ta%df%6^rf%ff&', 1d-2, TextSize, ActualPlotting)
i=winio@('Line Width %ta%dd%6^rd%ff&', 1, LineWidth, ActualPlotting)
i=winio@('Charset (-12 to +26)%ta%dd%6^rd%ff&', 1, iCharacterSetNo, ActualPlotting)
i=winio@('%cn%^tt[Re-Plot]&',ActualPlotting)
i=winio@('%ac[esc]', 'exit')
end
!---------------------------------------------------------------------------
integer function ActualPlotting ()
real*8 TextSize
integer LineWidth, iCharacterSetNo
common /aaa/TextSize, LineWidth, iCharacterSetNo, LWindow
Real*8 x(100), y(100), z(100), u(100), v(100), w(100)
N=100
A=20000
do i=1,N;
x(i)=i-1;
y(i)=A*sin(i/30.)**2;
z(i)=A*sin(i/30.)**5;
u(i)=A*sin(i/30.)**10;
v(i)=A*cos(i/30.)**10;
w(i)=A*sin(i/30.)**2 * cos(i/30.)**2;
enddo
CALL DIAGLV (0)
CALL TEXTMN(sngl(TextSize)) ! 45)
CALL AXLBJS('*C','C')
call thckmg('LINE', float(LineWidth))
call chset(iCharacterSetNo)
LWindow = 0
call window_update@(LWindow)
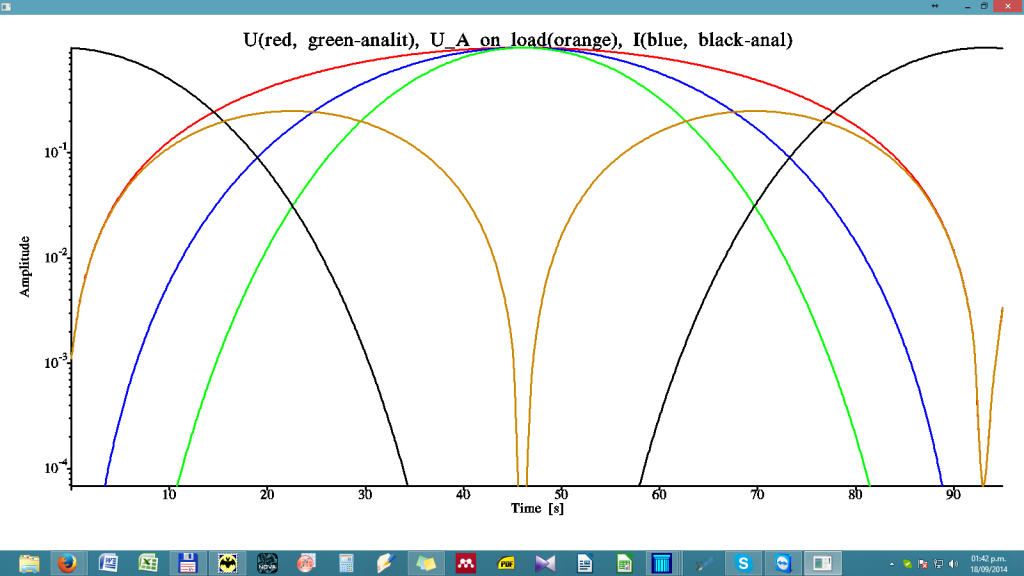
i=winio@('%ww%pv%pl[x_axis='Time [s]',y_axis=Amplitude,&
&title='U(red, green-analit), U_A on load(orange), I(blue, black-anal)', &
& colour=red, colour=blue, colour=green, colour=black, &
&colour=#CC8800, X_ARRAY, SCALE=LOG_LINEAR, N_GRAPHS=5]&',&
& 900, 600, N-4, x, y, z, u, v, w)
i=winio@('%ac[esc]&', 'exit')
i=winio@('%lw', LWindow)
ActualPlotting = 2
End function


 [/URL][/img][/code]
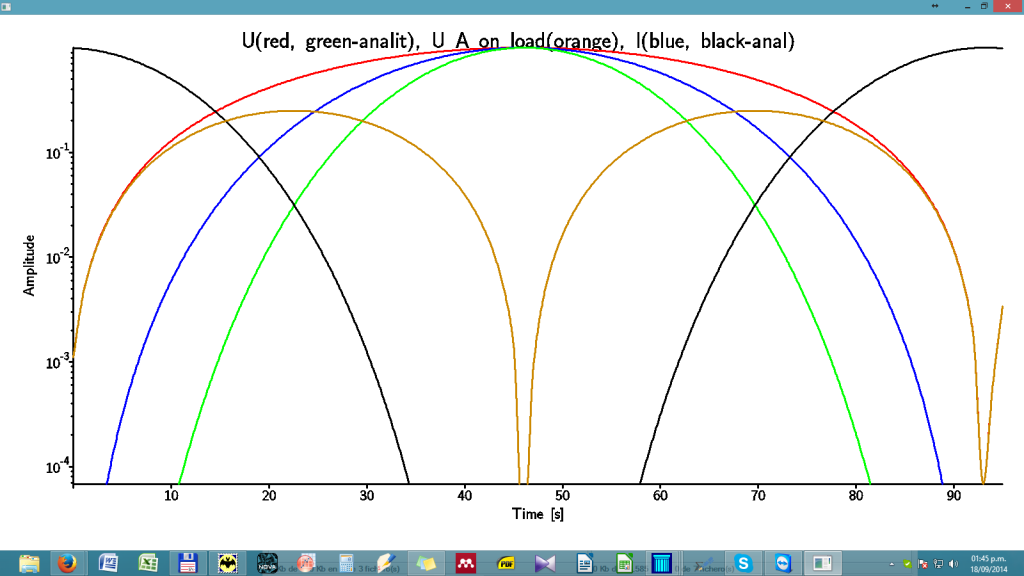 [/URL][/img]

