Silverfrost Forums

Welcome to our forums

Hershey fonts available for Simpleplot

13 Jun 2014 2:36 #14175

I changed the subject from the previous topic so that this message is not buried too deep in another discussion.....well.....Hershey fonts are available!!!....after a short but careful investigation, I remembered how Simpleplot was normally installed and among other things, the old intaller put a Simple.ini file in the Windows directory (today 'folder'). So I created a simple.ini file with only the statement

[General] HERSHEY=c:\Program Files (x86)\Silverfrost\FTN95\hershey.dat

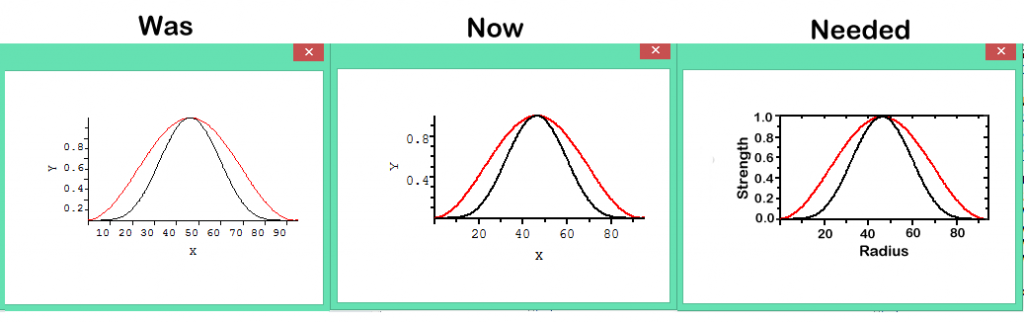
and put in the Windows folder.....and the hershey.dat file with simple.dll in the usual FTN95 place and...WORKS AS FINE AS EVER!......in fact, it seems that the labels are now correctly aligned with the ticks on the y axis....

I could put here a copy of the test file that shows the usual plot that I showed a couple of days ago with the Courier, Helvetica, etc. but I don't know how to put available the hershey.dat file to the community.....I could send it as attachment to John-Silver, but I do not know if there is some othe people also interested....DanRRight maybe?.

Please Paul, let me know how to procede......

Hope this helps,

Agustin

13 Jun 2014 3:01 #14178

If you send it to me via Silverfrost then I can upload it to make it available as a download.

13 Jun 2014 3:07 #14180

email to ftn95@silverfrost.com?

Agustin

13 Jun 2014 3:20 #14183

Yes, with a request to forward to me.

13 Jun 2014 3:25 #14184

already done!

Agustin

14 Jun 2014 6:41 #14190

Thanks Agustin. I have uploaded the file to http://www.silverfrost.com/beta/hershey.zip for now.

14 Jun 2014 4:58 #14193

Some history may help. The Command Processor (DOS Box) looks for named programs to run in the different paths given in the PATH environments variable. Your program might be able to access that, but in general, user-written programs look in the current subdirectory or one you specifically named. With Windows, you can start a program with a click on its datafiles, which means that (a) the datafile type needs to be associated with a particular program, (b) the working directory may not be where the program is located, and (c) it isn't just the EXE, but other things such as INI files and DLLs that have to be looked for. In early versions of Windows, a halfway house was used, but starting I don't remember when, this thing called the Registry was invented, which stores all the path information for such things as accompanying files. You can't just copy the EXE (unless it only uses Salflibc.dll, which is already set up in the Registry because FTN95 needs it) - you may need to either copy your EXE and everything it uses to the same directory, or you need to 'install' the program using a 'Setup' program. You probably noted that your program doesn't have an icon on the Desktop, doesn't appear on the Start menu etc etc, and these are other things that the setup program does for you. A number of us here use Jordan Russell Software's free Innosetup, which operates through a complicated script to do all the separate stages in this installation process. The particular advantage of it is that it also bundles all the files needed for an installation into one 'zipped' EXE file, which unpacks itself when it is run. In short, copying the EXE somewhere else is unlikely to work when you have these external files. Eddie

14 Jun 2014 5:14 #14194

No problem here!...I moved my exe file to another folder and run without problems....seems you have something wrong in your system....

best regards,

Agustin

P.S. John: I did not answer your private message as the Hershey file is now available for everyone....

14 Jun 2014 5:24 #14195

Probably i have done something wrong but i do not see any effect on %pl.

I made Simple.ini with the single line above, placed it in Windows dir and placed Hershey.dat into FTN95 dir. My OS is Windows 8.1.

14 Jun 2014 5:33 #14196
Program simple
use mswin
Real*8 x(100), y(100)
N=100
do i=1,N;
x(i)=i-1;
y(i)=sin(i/30.)**2;
enddo
CALL TEXTMN(0.1)
CALL AXLBJS('*C','C')
call thckmg('LINE',1.0)
call chset(10)
i=winio@('%pl[x_array]', 300, 200, N-4, x, y)
End 

test this simple code...it works fine here....

Agustin

14 Jun 2014 5:38 (Edited: 15 Jun 2014 7:36) #14197

Forgot to attach SPWIN module and Slink the code with SIMPLE.DLL

All works now great, thanks Agustin

How to change the font on this example to something different and more pleasant?

The tics are still a bit off though are looking MUCH much better. Look at this example

Program simple2
use mswin 
Real*8 x(100), y(100), z(100) 
N=100 
do i=1,N; 
x(i)=i-1; 
y(i)=sin(i/30.)**2; 
z(i)=sin(i/30.)**5; 
enddo 
CALL TEXTMN(0.3) 
CALL AXLBJS('*C','C') 
call thckmg('LINE',3.0) 
call chset(10) 
i=winio@('%pl[x_array, colour=red, colour=black, N_GRAPHS=2]&', 300, 200, N-4, x, y, z) 
i=winio@('%ac[esc]', 'exit') 
End

Here is an image demonstrating what we've got.

http://i1320.photobucket.com/albums/u523/rrr2005r/pl_was_now_neded4_zpsd3d42e03.png

The %pl now looks much better thanks to all the hacks you guys have done. The %pl is almost there, just little more glamour and we get professional look. The right one is how i like %pl to look as an absolute minimum

14 Jun 2014 6:52 #14198

='DanRRight']Forgot to attach SPWIN module and Slink the code with SIMPLE.DLL

All works now great, thanks Agustin

How to change the font on this example to something different and more pleasant?

change in the subroutine CHSET the argument from 1 to 24 (I don't have the table at home so I am guessing now) and you will get the software or Hershey fonts, with negative numbers you get the hardware fonts (Curier, Helvetica, Times Roman, etc.)...it's a question of playing...I put an example program in the Clearwin forum a couple of days ago that had a loop in order to show all the possible fonts in one run. Check there....

and for the problem of the four axis, well, I cannot do miracles, the limitation is in %pl not in Simpleplot......that's why I use only %pl for testing a program not for the final graphical output.....%dw works much better.....up to now....

Agustin

14 Jun 2014 7:29 (Edited: 14 Jun 2014 10:58) #14199

Quoted from DanRRight

The right one is how i like %pl to look as an absolute minimum

well....I WAS WRONG!....%pl is limited but not as much as I thought.

test this code and tell me if you like it....

Program simple5
use mswin
      INTEGER winio@,i,StartCB
      EXTERNAL StartCB
      i=winio@('%sy[no_border]%ca[User drawn]&')
      i=winio@('%pl[user_drawn]&',800,800)
      i=winio@('%sc',StartCB)
      END
!--The start-up callback
      INTEGER FUNCTION StartCB()
      use mswin 
      INTEGER N,i
      PARAMETER(N=101)
      REAL x(N),y(N)
!--Create the data.
      DO i=1,N
        x(i)=i-1
        y(i)=x(i)**2
      ENDDO
!--Call SIMPLEPLOT routines to plot the graph.
call picpos(4.0,5.0) ! locate the graph in the page so that everything enters 
CALL TITLE7('centre','Centre','Sample for Dan')
CALL SCALES(0.0,10.0,1,0.0,100.0,1)
call thckmg('LINE',1.0) !thickness of lines
CALL NEWPIC
CALL TITLE7('t','Centre','Sample')
call textmg(1.5)     !size of the text
call axsbtk('XC','I') !ticks inside for x axis
call axsbtk('YC','O') ! ticks outside for y axis
CALL AXLBJS('**', 'Centre') ! labels centred
call chset(8) ! character set
call cvtype(ctype) ! curve type
call thckmg('LINE',3.0) !thickness of lines
call pen(4) !pen colour
CALL AXIS7('XCartesian','x-axis')
CALL AXIS7('YCartesian',' ')
CALL AXLOCN('YCartesian', 'Following') ! locate a new y axis on right
call  axlban('yc','O') ! tick labels towards the outside
call axsbtk('yc','O') !ticks outside for y axis on the right
!call axclr('yc',1)! only axis is drawn without ticks if you prefer
CALL AXIS7('YCartesian','y-axis')
call axis7('YC',' ') ! draw the new y axis without title                     
CALL AXLOCN('XCartesian', 'Following') !locate a new x axis on top
call  axlban('xc','N') ! no tick labels                 
call axsbtk('xc','I') ! ticks inside
call axis7('XC','   ') ! no axis label                                                                                             
call thckmg('L',1.0) !line thickness = 1
call pen(2)!  colour red
CALL BRKNCV(x,y,N,-1)
CALL SIMPLEPLOT_REDRAW@
      StartCB=1
      END

four axis, ticks, labels, pen colours, line thicknesses, etc....I think that we don't need to redesign %pl for the moment and leave Paul thinking about other problems....

Hope this helps ,

Agustin 😄

14 Jun 2014 11:06 #14200

yes, I know......but in the last post he only said that he wanted that for %pl without any particular specification 😉......so I am allowed now to say that 'with %pl you can...' 😃

Agustin

15 Jun 2014 5:44 #14201

Agustin,

The whole idea is to have a graphics package which produces professional quality plots which do not need much further work (means the plots which are almost 99% ready to be placed into presentation or any high level publication).

Simpleplot is not the one, at least i have not seen almost anything decent looking. There is no sense to have just SIMPLE plots any way besides %pl, any other 'harder' way we can do that themselves via FTN95 graphics library - it is where FTN95 is so unique. We will then 100% control every aspect of own graphics package. This saves time

Here is what FTN95 can do easily - Surfaceplot, PieChart, 3D plot (these are just tiny parts of my code, there are 100s of graphs there, just the temporal Simleplot %pl i counted more then 40 instances). When you prepare the presentation you just grab by PrintScr the graphs from the screens (or FTN95 also allows to select part of image with mouse and save it in graphics format) and you are done in no time. The FTN95 is like a Gozdzilla versus all other mostly uninspiring Fortran compilers, the only it lacks is 64bits. If FTN95 developers controlled the Simpleplot sources (and opened them) then Simpleplot had a chance, it is designed not as bad actually, it just looks bad, which is fixable in a month

http://i1320.photobucket.com/albums/u523/rrr2005r/MyCodeSurfPlot_zps5c6fb231.png

http://i1320.photobucket.com/albums/u523/rrr2005r/PieChart_zps4c2db7b5.png

http://i1320.photobucket.com/albums/u523/rrr2005r/MyCode3DPlot2_zps7535756a.png

15 Jun 2014 12:57 #14202

Hello, world. I very sensibly married Judy Butland in 1964. Judy developed Simpleplot in 1974 at the University of Bradford, UK. We were AMAZED to find people still talking about Simpleplot in 2014. We are now well into our happy retirement in Bridlington, E Riding of Yorkshire, and the Centre of the Universe. We will help with Simpleplot problems if we can, but can promise nothing. It was all a long time ago. Meanwhile, we are helping 2 local school students develop BridPlot - an Android app for graphing. See www.bussmk2.co.uk for more details. BrodPlot is 'Designed by School Students in the UK for School Students all over the world'. If anyone has any contacts with schools in Foreign Parts, we would love to hear from them. If any old Simpleplot uses who still remember us are out there, get in touch. David Butland

15 Jun 2014 2:22 #14203

Dear David,

That was great news to meet you here in good mood and spirit! I do not know how many times we discussed here Simpleplot with all the regrets that you are not responding on emails because of your retirement. The feeling of serious loss was always the main theme. Please do not disappear and keep in touch with this group. Things are that time came to make for Simpleplot needed facelift and make some other fixes. I looked at your BrodPlot and was thinking that it is exactly what Simpleplot currently needs - to be both Simple and Pro, not just simple.

Besides i hope also that Windows tablets and cellphones will be next where this Fortran will be used so it would be great to see BrodPlot ported to Windows and able to communicate with Fortran.

Wish you all the best and a lot of fruitful communications with this one of the most friendly and caring communities on the web.

16 Jun 2014 9:08 #14211

I am mostly interested with quick plot function %pl which we discussed at the beginning of this thread. What needs to be fixed urgently there is

  1. fonts
  2. tick marks
  3. real*8 for graphics
  4. fix %pl numerous inconsistencies and bugs (like simpleplot_redraw@, inconsistency of using real4 vs real8 for max and min while using real*8 for everything else etc) adjustments of drawing surface to get scalable borders instead of fixed etc

Most of all if compiler developers have no access to the graphics library source code and the rights for its modification like it was so far then Simpleplot (or any other third part software) has no future because of a lot of adjustments and modifications are needed permanently and each user has own preferences. May be even better is to grant access to sources for everyone like it is the case with many other graphics packages but that is debatable. When i found that Silverfrost developers can not fix with %pl anything i stopped using it and not without regret switched to my own library made with FTN95 graphics functions. I lost a lot of time but you can see the screenshots above -- obtained plotting quality and freedom was worth of that time loss. I still admit that design principles of %pl and Simpleplot and their integration into FTN95 are better then mine, because i am not a professional programmer. If Simpleplot major defects will be fixed and appearance substantially improved (which based on my experience is really really easy, i hope) i may start using it again.

If that will be solved next would be expansion of options for %pl to allow it draw a lot more and better with the same ease. That may take many users and years to do. But if done right Clearwin will be used indefinitely, scientific plotting will be need in year 3000 too, and simplicity is its key principle, am i wrong? LOL

Other users have interest in the whole Simpleplot package. It also needs improvements and adjustments to look more modern. Most of fixes (again, using modern fonts and their positioning relative to tics, real8 numbering, labeling, using RGB colors and better looking palettes etc) could be done pretty fast. The reason to switch to real8 numbers is because that allows to get much less amount of annoying crashes of graphics, since it is pretty rare when you get numbers more or less then 1e300 or 1e-300 while this permanently happen with real*4 numbers

9 Sep 2014 1:48 #14606

Remember the Simpleplot hack our forum guys uncovered which fixes tick marks?

I got strange error which looks like this when i open same program twice(no matter where in the computer)

http://s23.postimg.org/xfqmebtjv/Image2.png

Any guess what that could be?

Here is the code for debugging. Run one exe and then not closing it run the another

!-------------------------------------------------------
!  Compilation: 
!
!ftn95 aaa.for /free /debug /no_truncate /undef 
!slink aaa.obj SIMPLE.DLL            
!
!-------------------------------------------------------
Program simple 

Real*8 x(100), y(100), z(100), u(100), v(100), w(100)
N=100 
do i=1,N; 
x(i)=i-1; 
y(i)=sin(i/30.)**2; 
z(i)=sin(i/30.)**5; 
u(i)=sin(i/30.)**10; 
v(i)=cos(i/30.)**10; 
w(i)=sin(i/30.)**2 * cos(i/30.)**2; 
enddo 
CALL TEXTMN(0.3) 
CALL AXLBJS('*C','C') 
call thckmg('LINE',3.0) 
call chset(10) 

i=winio@('%ww%pv%pl[x_axis='Time [s]',y_axis=Amplitude,&      
   &title='U(red, green-analit), U_A on load(orange), I(blue, black-anal)', &
   & x_array, colour=red, colour=blue, colour=green, colour=black, &
   &colour=#CC8800, X_ARRAY, N_GRAPHS=5]&',&
   & 300, 200, N-4, x, y, z, u, v, w) 
i=winio@('%ac[esc]', 'exit') 
End 

Also, this question is to Silverfrost: did you guys establish any communications with David Butland to solve Simpleplot problems? Any agreements on source code ?colour=#CC8800, X_ARRAY, N_GRAPHS=5

12 Sep 2014 4:18 #14635

I was testing your program and seems that the problem is with %pl. I have tried a modified version of it:

Program simple
use mswin
      INTEGER winio@,i,StartCB
      EXTERNAL StartCB
      i=winio@('%sy[no_border]%ca[User drawn]&')
      i=winio@('%pl[user_drawn]&',800,800)
      i=winio@('%sc',StartCB)
      END

!--The start-up callback
      INTEGER FUNCTION StartCB()
      use mswin !INCLUDE 'CLEARWIN.INS'
      INTEGER N,i
      integer*4 :: ans
  !--Call SIMPLEPLOT routines to plot the graph.
Real*4 x(100), y(100), z(100), u(100), v(100), w(100)
N=100
do i=1,N;
x(i)=i-1;
y(i)=sin(i/30.)**2;
z(i)=sin(i/30.)**5;
u(i)=sin(i/30.)**10;
v(i)=cos(i/30.)**10;
w(i)=sin(i/30.)**2 * cos(i/30.)**2;
enddo
call chset(25)
call axsbtk('XC','I')
call axsbtk('YC','O')
CALL AXLBJS('**', 'Centre')
call thckmg('L',2.0)
CALL SCALES(0.0,100.0,1,0.0,1.0,1)
call axes7('x-axis','y-axes')
call pen(1)
CALL BRKNCV(x,w,N,1)
call pen(2)
CALL BRKNCV(x,y,N,1)
call pen(3)
CALL BRKNCV(x,z,N,1)
call pen(4)
CALL BRKNCV(x,u,N,1)
call pen(5)
CALL BRKNCV(x,v,N,1)
call endplt
CALL SIMPLEPLOT_REDRAW@
      StartCB=1
      END

and I can open this program twice, even in the same folder....it seems that when you use Simpleplot subroutines directly, it works fine but as 'implicit' subroutines in %pl, does not. Therefore, it appears to be a problem with the implementation of %pl, not Simpleplot....

Hope this helps....

Agustin

P.D. as you say, it would be nice to hear from Silverfrost if they have eventually agreed (or not) with David Butland to work on an updated implementation of Simpleplot.

Please login to reply.