 |
forums.silverfrost.com
Welcome to the Silverfrost forums
|
| View previous topic :: View next topic |
| Author |
Message |
DanRRight
Joined: 10 Mar 2008
Posts: 2959
Location: South Pole, Antarctica
|
 Posted: Sat May 13, 2017 12:29 pm Post subject: Posted: Sat May 13, 2017 12:29 pm Post subject: |
 |
|
CONTINUE 4
Respect to color background used in the last example above, it was so easy to do and was so reliable in FTN77/95 that I made it and forgot for decades. Actually all is done in 5-6 lines of Fortran code after you loaded graphics background tiles. I have demo for it but it is larger then one or two post pages (too harsh restriction), because I also made a GUI and plotted some besier graphics on top. PM me and i will email it to you. Here is just the sketch for this, the rest anyone can do themselves.
| Code: |
1) count BMP files which will be used used as the graphics backgrounds (tiles). Note that ATTR_files, date_files, time_files are wacky size integer**2 which I always forget and make a mistake, though there may already exist more normal utility as we discussed that here few times
numbBkgFilesRealyExist = 0
filePAT = '*.bmp'
call files@ (filepat, numbBkgFilesRealyExist, numbBkgFiles, FileNameBkgBMP, ATTR_files, date_files, time_files, file_size)
2) then find their XY sizes and number of colors
do i = 1, numbBkgFilesRealyExist
file = FileNameBkgBMP(i)
call get_dib_size@(file, ixBkgBMPsize(i), iyBkgBMPsize(i), inb_colours, ier)
ihDibBkgFile(i) = import_bmp@(file, ires)
enddo
3) find the XY dimension of the graph where these tiles will be used
call get_graphical_resolution@(ixGrsize, iyGrsize)
4) and plot background over which you then plot your graphics. The icurBkgDispl is current choice of one of the graphics backgrounds
do ivert =1, iyGrsize/iyBkgBMPsize(icurBkgDispl)+1
do ihoriz=1, ixGrsize/ixBkgBMPsize(icurBkgDispl)+1
i = dib_paint@((ihoriz-1)*ixBkgBMPsize(icurBkgDispl), (ivert-1)*iyBkgBMPsize(icurBkgDispl), ihDibBkgFile(icurBkgDispl), 0, 0)
enddo
enddo
|
|
|
| Back to top |
|
 |
DanRRight
Joined: 10 Mar 2008
Posts: 2959
Location: South Pole, Antarctica
|
| Posted: Sun May 21, 2017 6:42 pm Post subject: |
|
|
CONTINUE 5
And the final point over i to the native %pl would be adding elements of visual Clearwin+ (which supposedly existed but I never have seen a single example of it. Is it still working and supported ? Pity of not, because this would change the mass perception of Fortran capabilities).
Currently all assembling of the plot has beed done purely by scripting/programming. Nice that adding %pv we can scale the size of the plot with the mouse, but we need more then that. Would be great to add the functionality when the user by pushing some control key like Ctrl or doubleclick can move axis and caption positions etc using his mouse (and possibly the arrow keys on the keyboard) as well as by clicking on the graph call and change all other properties of the plot.
If for example axis margins are set as variables @(ipos, jpos) instead of strict numbers @(33,4) these variables can be saved and used next time. This will make new %pl finally IDEAL tool no one ever had. This is how Fortran must operate. Instead it is currently purely suicidal scripting language leaving the major its advantage - almost natural syntax and almost ultimate simplicity (MATLAB language is Fortran-like and it is currently a simplicity and functionality king, if not yet, it definitely will. Because sadly at some point some morons magnetized people's common sense with the absurd claim that Fortran is just the FORmula TRANslation).
I implemented myself some of such visual functions using Clearwin graphics library in my graphics routines long ago and like this very much. Because this is ultimately exactly how it should be done in the ideal world. This is so easy to do that in comparison the correct tic numbering we are still discussing looks like a tedious job |
|
| Back to top |
|
|
LitusSaxonicum
Joined: 23 Aug 2005
Posts: 2431
Location: Yateley, Hants, UK
|
| Posted: Mon May 22, 2017 9:12 am Post subject: |
|
|
If I can add my very minor contribution, may I add to the plea for grid lines?
I often draw graphs with the same units on both axes: shear stress on one, direct stress on the other, and Excel doesn't let me set the scale the same for both. That effectively makes the grid exactly square. Excel doesn't plot graphs, but charts.
Eddie |
|
| Back to top |
|
|
LitusSaxonicum
Joined: 23 Aug 2005
Posts: 2431
Location: Yateley, Hants, UK
|
| Posted: Mon May 29, 2017 11:58 am Post subject: |
|
|
The image posted illustrates my issue precisely, because the grid lines define rectangular, not square, boxes. Thus the scales are not the same. The slope of the straight line plotted can be determined by Excel, and if you are interested in, say, y = m x + c, then m is readily obtained, even subject to various constraints, such as c cannot be less than 0. Even if you are interested in the line as y = x tan f + c, Excel can give you f in degrees, radians or whatever you want. The issue is that unless the scales are the same, you cant measure f with a protractor (thus making a trap for student idiots) and if the scales are very different, the visual perception of the angle f is skewed. Working in a field where f has some meaning (calm down dear, this convention was set hundreds of years ago and isnt my fault), it isnt a show-stopper, but it gets in the way of instant recognition when you see the printout.
You need equality of scales if, for example, Mohrs Circle is not to appear as an ellipse.
Not that it matters for an instant when looking on a screen, but the hard copy has the additional shortcoming that the scale isnt really rational, as in (say) 10mm represents 20 kPa (or 1 inch = 30 psi). Meaning you cant scale off it easily.
If someone can point me to a way of getting the x and y axis scales exactly the same and rational in Excel, then I would be in their debt.
As to a matter of semantics, of course it is so, and I have defined things to mean what I intend them to mean, a la Red Queen. But Excels charts allow you to plot things that obfuscate data relationships as easily as it can clarify them, earning from me the disparaging charts (spat contemptuously!) appellation as against the engineer or scientists graph (spoken in hushed tones with an air of approbation!). Where does this semantics come from? Probably from graph paper usually ruled in squares.
Eddie |
|
| Back to top |
|
|
DanRRight
Joined: 10 Mar 2008
Posts: 2959
Location: South Pole, Antarctica
|
| Posted: Thu Jun 08, 2017 9:49 am Post subject: |
|
|
John, Here is the link on my Microsoft Onedrive open account, file IdealPL.zip has data, sources and examples made in OriginLab for visual comparison with professional scientific graphics software
| Code: |
| https://1drv.ms/u/s!Ao024Ta1-aVRhylqx47UY5Sx6W0p |
Other demos are also open for everyone (excluding EXE file and PS_problem were for my own use) |
|
| Back to top |
|
|
DanRRight
Joined: 10 Mar 2008
Posts: 2959
Location: South Pole, Antarctica
|
| Posted: Fri Jun 09, 2017 4:02 pm Post subject: |
|
|
John,
You can rearrange these two windows from stacking vertical to horizontal position adding just a pair of %ob/%cb for these two lines
| Code: |
i=winio@('%ww[no_border]%ob&')
i=winio@('%gr[BLACK]%ff%cb%lw&',660, 550, ilw)
|
Vertical window positioning was taken because i used large resolution 3840x2160 (4k TV as a PC monitor).
/** which i also recommend to everyone - this is way cheaper and infinitely better than any non-4k real PC large monitors in the world. Latter one because there are no PC monitors of size ~50" but this is exactly the minimum size all monitors have to have. As the owner of many top notch monitors in the past (i hated some of them despite their sometimes $3-4K price tags) i will assure that you will be stunned both with the improved quality of work and entertainment. Also, before, couple years back, only NVIDIA 900 series videocards worked with 4K monitors via HDMI ports, but today probably all work (the only condition for good text rendering is that the monitor has to support 60Hz at 4:4:4 chroma simultaneously. And if your kids play games on it then it has to have also small input lag ~25ms or less in game mode. There such good chroma bandwidth is rarely needed. Consumption is by the way only 72W in my case of 50", less then for 2-3x smaller CRT monitors). |
|
| Back to top |
|
|
PaulLaidler
Site Admin
Joined: 21 Feb 2005
Posts: 8309
Location: Salford, UK
|
| Posted: Wed Jun 21, 2017 10:21 am Post subject: |
|
|
| The 64 bit case runs OK for me. I will take a look at the 32 bit case. |
|
| Back to top |
|
|
DanRRight
Joined: 10 Mar 2008
Posts: 2959
Location: South Pole, Antarctica
|
| Posted: Wed Jun 21, 2017 11:00 pm Post subject: |
|
|
John,
1) What are your screen dimensions? You may not see all these problems if you resize the plot but the screen size is not large enough
2) The Silverfrost demo code you posted crashes in 32bit case too.
The 64 run OK
BTW, from my quick look : what is ENUMERATOR and the code with it for? |
|
| Back to top |
|
|
PaulLaidler
Site Admin
Joined: 21 Feb 2005
Posts: 8309
Location: Salford, UK
|
| Posted: Thu Jun 22, 2017 9:02 am Post subject: |
|
|
John
I have not looked at this yet but I think that Dan has highlighted the problem...
The new ENUM feature is not working in this program for 32 bits. Try using PARAMETER instead. |
|
| Back to top |
|
|
PaulLaidler
Site Admin
Joined: 21 Feb 2005
Posts: 8309
Location: Salford, UK
|
| Posted: Sat Jun 24, 2017 11:18 am Post subject: |
|
|
John
I don't reognise the error report and I don't have access to a PC at the moment.
For the code
| Code: |
ENUM,BIND(C)
ENUMERATOR::link_none=0,link_lines,link_curves !values 0,1,2
ENUMERATOR::all_graphs=0,graph1 !values 0,1
END ENUM |
use
| Code: |
INTEGER,PARAMETER::link_none=0
INTEGER,PARAMETER::link_lines=1
INTEGER,PARAMETER::link_curves=2
|
etc. ENUMERATOR simply provides automatic numbering of integer values. |
|
| Back to top |
|
|
Kenneth_Smith
Joined: 18 May 2012
Posts: 866
Location: Lanarkshire, Scotland.
|
| Posted: Mon Jun 26, 2017 3:45 pm Post subject: |
|
|
Paul,
I curious to know if you have been able to make any progress with the suggestions I made back at the beginning of May?
Thanks
Ken |
|
| Back to top |
|
|
PaulLaidler
Site Admin
Joined: 21 Feb 2005
Posts: 8309
Location: Salford, UK
|
| Posted: Mon Jun 26, 2017 7:00 pm Post subject: |
|
|
Ken
I haven't done any work on this for a while. I am hoping to review this thread an make some final adjustments some time before the next full release. |
|
| Back to top |
|
|
Kenneth_Smith
Joined: 18 May 2012
Posts: 866
Location: Lanarkshire, Scotland.
|
| Posted: Mon Jun 26, 2017 10:06 pm Post subject: |
|
|
Thanks Paul. I found myself looking at the native %pl again today after 6 weeks doing other things and rediscovering some of the minor issues for a second time - my memory is not as good as it used to be - hence the question.
Ken |
|
| Back to top |
|
|
DanRRight
Joined: 10 Mar 2008
Posts: 2959
Location: South Pole, Antarctica
|
| Posted: Mon Jul 03, 2017 4:01 pm Post subject: |
|
|
Addition to my post called CONTINUE2 above about LOG scale.
1) With the latest DLLs i found that the code produces initially bad looking Y scale numbering and goes out of scale, see for example this simple code (the code for plotting must be always short and simple like this or even shorter)
| Code: |
use clrwin
parameter (N=5)
real*8 X(N), Y(N)
Data X/1e1, 1e2, 1e3, 1e4, 1e5/
Data Y/2.2, 66, 8333, 1111, 777/
i=winio@('%ww%pv%pl[framed,x_array,scale=log_log,N_GRAPHS=1]%es', 625,500, N, X, Y)
end |
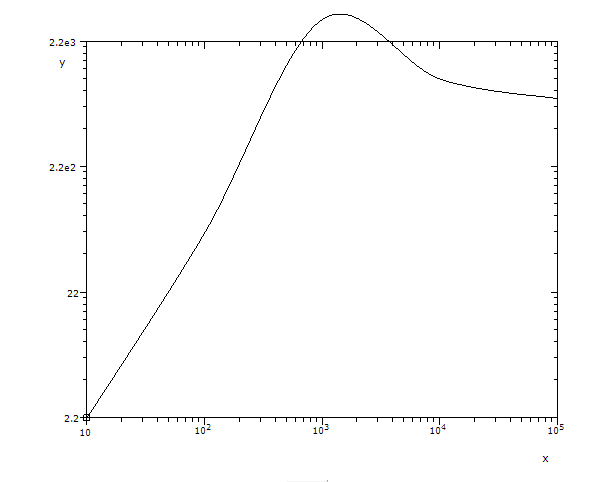
But if you try to resize the plot just a tiny bit pulling window border or corner using mouse it abruptly displays everything correctly.
Interesting is that if we change one number 8333 to 3333 this trick does not work
Probably will be easy to fix.
2) I hope that in the future after fixing all the bugs Silverfrost will make the default plotting with the one simple command like with the code above and the plot will look nice and perfectly ready for publication. This is how Matlab is doing that flattening competition landscape for decades. Of course it is easy to do all the "beautifications" with just one-two more lines of code like here
| Code: |
use clrwin
parameter (N=5)
real*8 X(N), Y(N)
Data X/1e1, 1e2, 1e3, 1e4, 1e5/
Data Y/2.2, 66, 8333, 1111, 777/
i=winio@('%sf%ts%bf%es&', 2d0)
call winop@("%pl[axes_pen=3,width=3,x_axis='X Axis Title',y_axis='Y Axis Title']")
i=winio@('%ww%pv%pl[native,framed,x_array,scale=log_log,N_GRAPHS=1]', 625,500, n, X, Y)
end |
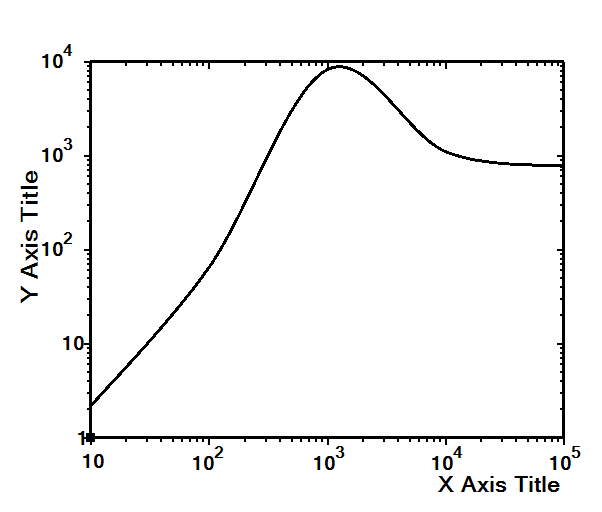
But my previous two decades experience with the hundreds of uses of Simpleplot in my codes tells me that beautification takes a lot of time so that you end up with no any. As a result many my plots which were quickly made look ugly like the first picture above, and there is no time to change anything because any touch to the working CWP code always causes many recompilations, CWP has a lot of intricate details you always forget.
This nicer looking example shows the defects of absence of Scientific, Decimal etc numbering formatting options: the numbering does not look concise, in one style, it mixes different styles.
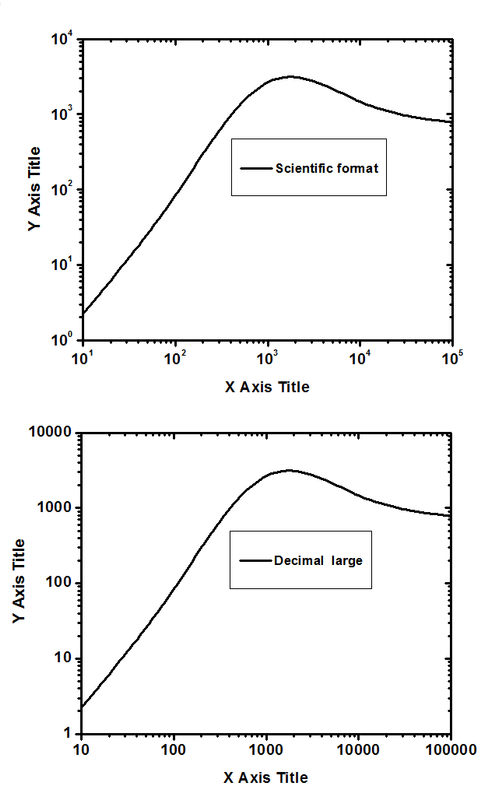
3) As to the numbering formats of LOG plots we here suggested to introduce few distinct user-definable formatting options: Scientific (numbers shown as 10^0, 10^1, 10^2, 10^3 etc) and Decimal (1, 10, 100, 1000...). All these ( and few other options like Engineering (1e0, 1e1, 1e2, 1e3) and Decimal with FP (1.0, 2.0, 3.0) ) are already there, they just need to be introduced into the user changeable settings.
With the LOG scale it is often possible for the code to choose these formats automatically: if the numbers are very small or very large and there are a lot of orders of magnitude to display then just the Scientific format has to be used
At the end here how this exact XY data is visualized by the professional scientific software using Scientific and Decimal formats. As you can compare the new %PL is already pretty close to the best of the best (the new PL can also do antialiasing for curves and in this example is even better doing data interpolation - compare how 8333 peak values are displayed)
Decimal format is of course the most difficult. If extend the plotted data to
| Code: |
0.01 0.011
0.1 0.044
1 0.33
10 2.2
100 66
1000 8333
10000 1111
100000 777 |
the OriginLab plots it this way
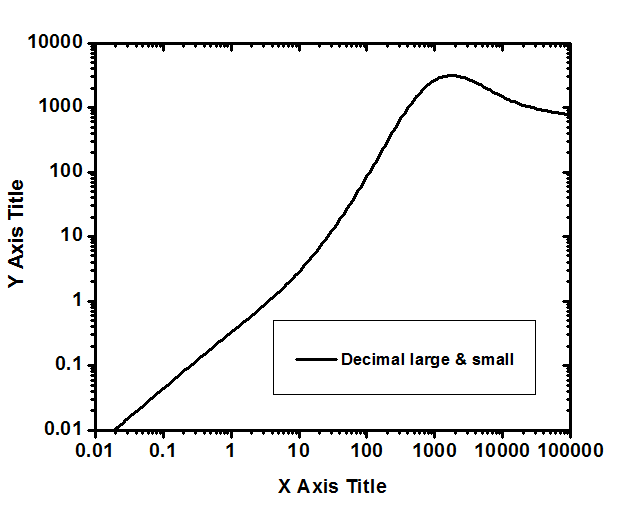
and if even more then 1e-3, 1e-4 ...
Last edited by DanRRight on Sun Apr 15, 2018 11:28 am; edited 4 times in total |
|
| Back to top |
|
|
DanRRight
Joined: 10 Mar 2008
Posts: 2959
Location: South Pole, Antarctica
|
| Posted: Fri Jul 07, 2017 5:11 pm Post subject: |
|
|
| I see same plot like you. Bug. |
|
| Back to top |
|
|
|
|
You cannot post new topics in this forum
You cannot reply to topics in this forum
You cannot edit your posts in this forum
You cannot delete your posts in this forum
You cannot vote in polls in this forum
|
Powered by phpBB © 2001, 2005 phpBB Group
|

