| View previous topic :: View next topic |
| Author |
Message |
PaulLaidler
Site Admin
Joined: 21 Feb 2005
Posts: 8254
Location: Salford, UK
|
 Posted: Fri Sep 14, 2018 7:36 am Post subject: Posted: Fri Sep 14, 2018 7:36 am Post subject: |
 |
|
| Thanks John. I will take a look at this when I can and then get back to you for the next one. |
|
| Back to top |
|
 |
PaulLaidler
Site Admin
Joined: 21 Feb 2005
Posts: 8254
Location: Salford, UK
|
| Posted: Mon Oct 01, 2018 7:38 am Post subject: |
|
|
| I will post a message immediately after it is fixed. |
|
| Back to top |
|
|
LitusSaxonicum
Joined: 23 Aug 2005
Posts: 2415
Location: Yateley, Hants, UK
|
| Posted: Mon Oct 01, 2018 2:47 pm Post subject: |
|
|
| Well, J-S, I've read some tosh in my time, but this doesn't seem to have been authored by anyone on the Fortran Committee. Is it a case of someone using %pl to draw photographs? I think we should be told. |
|
| Back to top |
|
|
PaulLaidler
Site Admin
Joined: 21 Feb 2005
Posts: 8254
Location: Salford, UK
|
| Posted: Mon Oct 01, 2018 3:25 pm Post subject: |
|
|
John
Your sample is fine. I will get to it when I can. |
|
| Back to top |
|
|
PaulLaidler
Site Admin
Joined: 21 Feb 2005
Posts: 8254
Location: Salford, UK
|
| Posted: Tue Nov 06, 2018 7:57 pm Post subject: |
|
|
| No. It's nearing the top of the list and not forgotten. |
|
| Back to top |
|
|
PaulLaidler
Site Admin
Joined: 21 Feb 2005
Posts: 8254
Location: Salford, UK
|
| Posted: Wed Nov 07, 2018 4:58 pm Post subject: |
|
|
| This particular problem with the position of the Y caption has now been fixed for the next release of the DLLs. |
|
| Back to top |
|
|
PaulLaidler
Site Admin
Joined: 21 Feb 2005
Posts: 8254
Location: Salford, UK
|
| Posted: Thu Nov 08, 2018 9:22 am Post subject: |
|
|
The bug was in the rounding process and became apparent when it was used to calculate the minimum value of y in this particular sample. The same rounding process is used for all the max and min values so the fix will hopefully make things better all round (i.e. when the programmer does not provide max and min values).
If there are other issues then I will wait till they are reported. |
|
| Back to top |
|
|
PaulLaidler
Site Admin
Joined: 21 Feb 2005
Posts: 8254
Location: Salford, UK
|
| Posted: Sun May 26, 2019 6:45 am Post subject: |
|
|
John
Can you provide a link to the source code for this sample. |
|
| Back to top |
|
|
DanRRight
Joined: 10 Mar 2008
Posts: 2937
Location: South Pole, Antarctica
|
| Posted: Sun May 26, 2019 10:59 am Post subject: |
|
|
Paul, Source code is on previous page at the beginning of this thread.
I agree with John that numbers and tic marks have some space between. Including the same in LOG plots.
As to choosing good numbers as tic marks - this could be hard to implement. Currently plotter makes reasonable number of tic marks (not too many or too little) and teach it to choose additionally good looking for humans rounded numbers could be daunting task. This may need manual adjustment.
Here also my suggestions which could be easily implemented
1) I'd add also that "framed" part has to automatically take the same line width as other axis have. For it to be 1 pixel wide by default is not reasonable.
2) Can Y-axis numbering position be adjusted manually respect to ends of tick marks in case it is needed?
(I suppose the Y axis caption text will try to position itself centered automatically using available space till possible, but could be also adjusted manually) |
|
| Back to top |
|
|
LitusSaxonicum
Joined: 23 Aug 2005
Posts: 2415
Location: Yateley, Hants, UK
|
| Posted: Wed Jul 24, 2019 8:15 am Post subject: |
|
|
Just out of interest, are these issues resolved withing SimDem? The examples seem to indicate that they are.
If so, (a) why not use it, (b) whoever's fixing %pl knows where to go for the answers !
If not, then ?
Eddie |
|
| Back to top |
|
|
PaulLaidler
Site Admin
Joined: 21 Feb 2005
Posts: 8254
Location: Salford, UK
|
| Posted: Wed Jul 24, 2019 8:23 am Post subject: |
|
|
Eddie
At the moment there is no overlap in this sense. SimDem provides a set of routines that call into the ClearWin+ library. |
|
| Back to top |
|
|
LitusSaxonicum
Joined: 23 Aug 2005
Posts: 2415
Location: Yateley, Hants, UK
|
| Posted: Wed Jul 24, 2019 8:46 am Post subject: |
|
|
Hi Paul,
What I meant was that the algorithms might be there.
Alternatively, John & Dan could use it, perhaps by extracting the bits they need.
Eddie |
|
| Back to top |
|
|
PaulLaidler
Site Admin
Joined: 21 Feb 2005
Posts: 8254
Location: Salford, UK
|
| Posted: Wed Apr 08, 2020 4:35 pm Post subject: |
|
|
The question at the start of this thread was raised in Sept 2018 and I have it on my list of things to look at when I get a moment to spare.
Well I don't really have a moment to spare but I want to get it off my list so here are my thoughts.
First of all, I don't want to get into a conversation on this issue so this will be my only response.
I agree that the native %pl does not respond well to the use of large fonts. However in this program the initial size of the graph is clearly too small for the given font. It is not surprising that %pl has failed to do anything reasonable with this font size in the initial graph size that the programmer has provided.
There are also two heavy demands in this code. 1) The data is not good and 2) a pivot (%pv) is provided.
The native %pl was never intended to be that clever.
I am generally pleased with what users have been able to do with the native %pl whilst at the same time recognising that it is bound to have its limitations.
So in short, I don't propose to make any adjustments based on this sample code. |
|
| Back to top |
|
|
DanRRight
Joined: 10 Mar 2008
Posts: 2937
Location: South Pole, Antarctica
|
| Posted: Thu Apr 09, 2020 10:03 am Post subject: |
|
|
Yes, this data plotted with %pl such way is not looking good, see below again where I compare it one-to-one with Origin. But I propose better solution:
1) make a default not the link=curves like with this example, but link=lines. In this case Paul does not have to do anything today with this specific problem at all
This my suggestion comes from the fact of difficulty to find one universal smoothing solution for all cases, Paul is right here. To find coronavirus cure is easier. Hence if there will be no smoothing in %pl by default at least for a while people will understand that. Straight lines is the only stable method. It works OK for cases where you have many points, not just 3-5 changing wildly like in this example above. This example initially was constructed for using with LOG scales where it looks not that bad. I do not use smoothing in 99% of my plots made in %pl and they often are OK
2) Even more, I propose that Silverfrost to offer everyone to find the problem with the current smoothing algorithm and add any other methods people want
I tried this data set above to plot in ORIGIN plotting software and even this professional app failed with Spline creating total garbage. If also offers smoothing with 2-point Segment, 3-point Segment, B-Spline, Bezier, Step Horiz, Step Vert, Step Center, Straight Line. The Straight Line, Bezier and B-spline plotted something amicable, and last two even looking very nice but look how different they are from just the real data connected with the straight lines! First plot is %pl with default "link=curves", second is Origin:
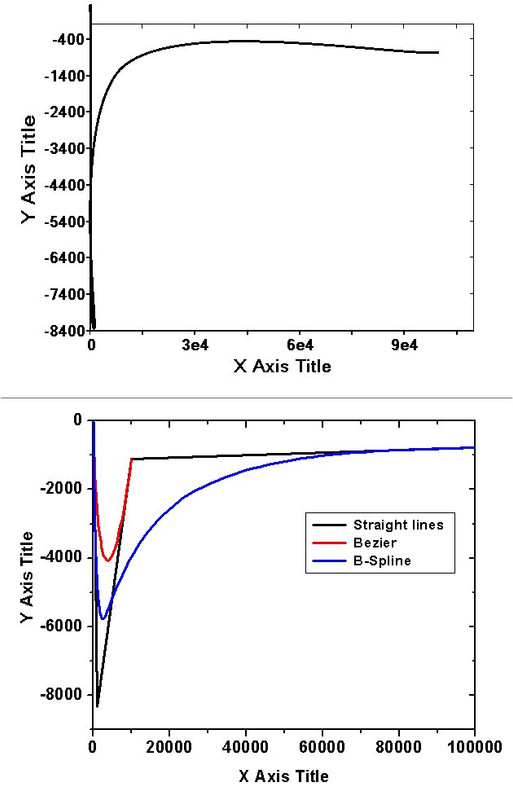
So there are no universal solution for smoothing but I hope with time there will be offered additional options besides current two. I personally like B-Spline most, it always worked with much less problems than other algorithms if there are no large functional changes
3) Other problems mentioned in this post are purely small adjustments:
- increasing default tic length (specifically with minor tics in LOG scale which can not be increased with additional WINOP )
- add a tiny bit of distance between numbers and tics
- make consistent same width of the whole frame so that an additional WINOP to fix that will not be needed
- make default line widths not 1 but 2 pixels wide
- I do not see any problems with the large fonts here. Actually fonts often have to be like that for the conference presentations.
- The best solution for smoothing in the future when no one will complain is to make smoothing variable: you click on your plot and popping slider allows to adjust smoothing from Straight Lines to say B-spline. This way I do fitting for example. Very handy
Last edited by DanRRight on Thu Apr 09, 2020 10:50 pm; edited 3 times in total |
|
| Back to top |
|
|
|

