| View previous topic :: View next topic |
| Author |
Message |
DanRRight
Joined: 10 Mar 2008
Posts: 2937
Location: South Pole, Antarctica
|
 Posted: Fri Nov 08, 2019 7:25 am Post subject: Posted: Fri Nov 08, 2019 7:25 am Post subject: |
 |
|
 |
|
| Back to top |
|
 |
mecej4
Joined: 31 Oct 2006
Posts: 1901
|
| Posted: Fri Nov 08, 2019 4:19 pm Post subject: |
|
|
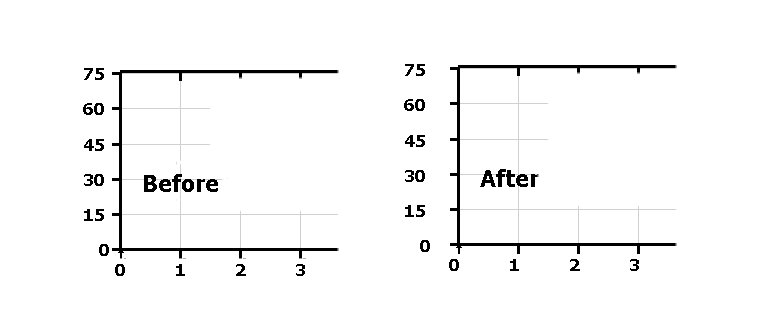
Something that struck my eye:
In both, the tick for 75 at the upper left corner is not quite aligned with the top frame line. This is in contrast with the other tick marks such as 60, 45, etc., which are nicely centered on the faint grid lines.
There is a small triangle at the origin. Does that have any significance? |
|
| Back to top |
|
|
DanRRight
Joined: 10 Mar 2008
Posts: 2937
Location: South Pole, Antarctica
|
| Posted: Fri Nov 08, 2019 7:33 pm Post subject: |
|
|
After i apply draw_characters@ which plots the text string "Before" or "After" on top of %pl plot the Y numbers and a bit X one too shift to the left
As to tiny triangle or sometimes square in the zero position of axis X and Y - this is small bug of %pl we pointed out few times before. This definitely has to be fixed by SFrost.
This so annoyed me that I extracted this part but the damn devilry thing disappeared and did not allow me to catch the problem so far. So what I often do is I create the %pl plot with shifted numbering, make a screenshot and photoshop the image moving numbers back as well as edit this tiny triangle or box in the corner. "Before" part of this plot above is exactly photoshopped part forgetting only to remove the triangle
My suggestion is to ask Paul to allow multiple title legends instead of just one. That will prevent us hacking with draw_characters@ when adding text on top is needed
By the way when I make the plot for the first time or close and reopen it again all looks OK. The shift appears when I add draw_characters@ text on top of already existing plot. I realize that %pl may not like dynamic updates in this case but it's so convenient to place numerous buttons and radiobuttons on the same window as %pl for adjusting the plot without closing it and plotting again. I already do that 1000 times per day
As to "In both, the tick for 75 at the upper left corner is not quite aligned with the top frame line" - this does not matter actually, it does not have to align. It may look a bit nicer in this specific case if it aligned though |
|
| Back to top |
|
|
DanRRight
Joined: 10 Mar 2008
Posts: 2937
Location: South Pole, Antarctica
|
| Posted: Tue Nov 12, 2019 12:55 am Post subject: |
|
|
Here is what ideal %pl should allow. Google public data plot. All dynamically changeable, plots, axis units, limits. All visually with the click. There are different types of plots, just click around.
Place the entire link into your browser, usual way of showing links does not work. Click on Switzerland or USA and watch magic. Do not worry for safety, this is Google, because if you do not trust Goggle then better do not use internet at all
https://www.google.com/publicdata/explore?ds=d5bncppjof8f9_&met_y=ny_gdp_pcap_cd&idim=country:AZE:GEO:TUR&hl=en&dl=en#!ctype=l&strail=false&bcs=d&nselm=h&met_y=ny_gdp_pcap_pp_kd&scale_y=lin&ind_y=false&rdim=region&idim=country:RUS:GRC:GBR:USA&ifdim=region&hl=en_US&dl=en&ind=false |
|
| Back to top |
|
|
DanRRight
Joined: 10 Mar 2008
Posts: 2937
Location: South Pole, Antarctica
|
| Posted: Tue Nov 12, 2019 10:31 pm Post subject: |
|
|
John,
1) If you can make a small demo reproducing shift of numbering when you dynamically add and remove draw_character@ after you already created the plot -- that would be great
2) I initially did not understand your need with the additional functions to find exact position or tics etc. Now i see the reasons for that. The %pl for example sets initial or final value for X by its own way ignoring user defined numbers. This is good and right thing to do but we do not know in advance or after plot was done how to find these new X and Y limits values to define the correct scaling for user other needs. The tic marks for example will be impossible to do manually if you do not know initial and find values of X or Y.
The position of caption will be impossible to place in exact place of the plot etc
3) As i described it above the user has little control over exact numbers for start and finish of X and Y axis which sometimes is needed
4) I do not know if this is already done but in my version of software if you set the step of placing tic marks this has no effect.
But in general with the user adjustments, settings and manipulations i almost always succeed to make professionally looking plots. If SFrost would listen users more actively and communicate with them more often my wish of making pro plots from the first attempt with the minimal programming (ideally in one single line of Fortran source text) would be already realized. |
|
| Back to top |
|
|
DanRRight
Joined: 10 Mar 2008
Posts: 2937
Location: South Pole, Antarctica
|
| Posted: Sun Dec 22, 2019 6:17 am Post subject: |
|
|
New release is soon coming. Curious was this most annoying defect fixes already ? Or is there a workaround against of it ? You can not photoshop it after saving. Probably applying another bug mentioned above (placing characters on top) it is possible to move numbering to the left but i am not sure it always will work. In demo reproducer i was unable to repeat it
 |
|
| Back to top |
|
|
DanRRight
Joined: 10 Mar 2008
Posts: 2937
Location: South Pole, Antarctica
|
| Posted: Tue Dec 24, 2019 10:10 am Post subject: |
|
|
I forgot if another suggestion was mentioned to change not convenient
CALL winop@("%pl[symbol=8]")
CALL winop@("%pl[symbol_size=4]")
to convenient
CALL winop@("%pl[symbol]", 7)
CALL winop@("%pl[symbol_size]", 4)
Otherwise if you need to dynamically change width and type of symbols you will need to add a lot of source text for each of multiple curves plotted simultaneously
character chLineWid*16, chSymbolType*16, chSymbolSize*18
chSymbolType = '%pl[symbol= ]'
write(chSymbolType(12:13),'(i2)',err=301) iSymbolType_f_x(6)
goto 1301
301 chSymbolType = '%pl[symbol= 7]'
1301 CALL winop@(chSymbolType)
chSymbolSize = '%pl[symbol_size= ]'
write(chSymbolSize(17:17),'(i1)',err=2301) iSymbolSize_f_x(6)
goro 3301
2301 chSymbolSize = '%pl[symbol_size= 4]'
3301 CALL winop@(chSymbolSize) |
|
| Back to top |
|
|
PaulLaidler
Site Admin
Joined: 21 Feb 2005
Posts: 8255
Location: Salford, UK
|
| Posted: Tue Dec 24, 2019 11:25 am Post subject: |
|
|
I have made a note to add a new function.
In the meantime, is it not possible to write the new function in Fortran? |
|
| Back to top |
|
|
Kenneth_Smith
Joined: 18 May 2012
Posts: 837
Location: Lanarkshire, Scotland.
|
| Posted: Tue Dec 24, 2019 11:55 am Post subject: |
|
|
Paul,
If you are going to be looking at %pl again, can I suggest that two additional symbols would be a valuable addition (to myself anyway):
[symbol=12] Draw +
[symbol=13] Draw X
Merry Christmas everybody!
Ken |
|
| Back to top |
|
|
PaulLaidler
Site Admin
Joined: 21 Feb 2005
Posts: 8255
Location: Salford, UK
|
| Posted: Tue Dec 24, 2019 3:00 pm Post subject: |
|
|
Ken
I can add this to the list but it is quite independent of the previous request which simply requires a little function to covert the arguments.
Paul |
|
| Back to top |
|
|
PaulLaidler
Site Admin
Joined: 21 Feb 2005
Posts: 8255
Location: Salford, UK
|
| Posted: Tue Dec 24, 2019 4:38 pm Post subject: |
|
|
Dan
A set of routines is already available as described in item 406 of cwplus.enh....
SUBROUTINE WINOP_INT@(fmt, dval)
SUBROUTINE WINOP_FLT@(fmt, fval)
SUBROUTINE WINOP_CLR@(fmt, cval) !for colours
SUBROUTINE WINOP_STR@(fmt, sval)
SUBROUTINE WINOP_HDL@(fmt, hval)
SUBROUTINE WINOP_FUN@(fmt, fun)
CHARACTER(*) fmt,sval
INTEGER dval,cval
DOUBLE PRECISION fval
INTEGER(7) hval
DOUBLE PRECISION FUNCTION fun(x)
DOUBLE PRECISION x |
|
| Back to top |
|
|
DanRRight
Joined: 10 Mar 2008
Posts: 2937
Location: South Pole, Antarctica
|
| Posted: Sun Dec 29, 2019 5:42 pm Post subject: |
|
|
Thanks Paul. Is this any better and faster cure then the way I provided ? Was there any particular reason to implement this such cumbersome way? This solution halted my brain to understand why, say, changing number 8 to 7 will require to fly through Australia. In the Help no reasoning or examples showing advantages of using was provided. Why not implement
CALL winop@("%pl[symbol=7]")
by obvious way
CALL winop@("%pl[symbol]", 7)
or at least kind of semi-standard Clearwin way
CALL winop@("%pl[symbol=@]", 7) ??? Will this allow to change plot parameters (widths, symbol sizes etc) dynamically after the plot was already made while my way will not? The minimal size but nicest looking working examples always help to understand these features. |
|
| Back to top |
|
|
PaulLaidler
Site Admin
Joined: 21 Feb 2005
Posts: 8255
Location: Salford, UK
|
| Posted: Mon Dec 30, 2019 9:23 am Post subject: |
|
|
Dan
This is what you asked for and is already available (maybe because you asked for it previously).
Where you asked for:
CALL winop@("%pl[symbol]", 7)
you must write:
CALL winop_int@("%pl[symbol]", 7)
The new functions were provided in the simplest and most natural way available when writing DLL functions in C for a Fortran or C++ source. The new functions could have overloaded the name winop@ but (for me) that would not be the natural way to do it. There will be no noticeable difference in speed. |
|
| Back to top |
|
|
DanRRight
Joined: 10 Mar 2008
Posts: 2937
Location: South Pole, Antarctica
|
| Posted: Tue Dec 31, 2019 12:07 am Post subject: |
|
|
| This does not look as bad as I thought. It's a bit puzzling without an example. But now I understand. Thanks |
|
| Back to top |
|
|
mecej4
Joined: 31 Oct 2006
Posts: 1901
|
| Posted: Fri Jan 03, 2020 1:01 pm Post subject: |
|
|
This loaded meaning of the common word "overload" made me confused, too, when I first came across it in the 1990-s.
An overloaded word has to bear the burden of having multiple meanings. For example, the verb "put" is given 57 different definitions in the Oxford English Dictionary.
Please see https://en.wikibooks.org/wiki/Computer_Programming/Function_overloading . |
|
| Back to top |
|
|
|

