| View previous topic :: View next topic |
| Author |
Message |
LitusSaxonicum
Joined: 23 Aug 2005
Posts: 2402
Location: Yateley, Hants, UK
|
 Posted: Sat Oct 06, 2018 4:56 pm Post subject: Posted: Sat Oct 06, 2018 4:56 pm Post subject: |
 |
|
And especially frustrating because probably 20 are my hits, also looking to see if anyone answered!
Eddie |
|
| Back to top |
|
 |
DanRRight
Joined: 10 Mar 2008
Posts: 2923
Location: South Pole, Antarctica
|
 Posted: Mon Oct 08, 2018 6:30 am Post subject: Posted: Mon Oct 08, 2018 6:30 am Post subject: |
 |
|
Who controls the SIMDEM source code, who supports it, can Silverfrost or even users modify anything in it? If SIMDEM authors control it what will happen when they abandon (stop support or retire) the product?
These questions arise because we do not need one more lemon like Simpleplot which had non-fixable bugs since the source code was not available to Silverfrost while the SP authors stopped support and retired. |
|
| Back to top |
|
 |
mecej4
Joined: 31 Oct 2006
Posts: 1899
|
|
| Back to top |
|
 |
Robert

Joined: 29 Nov 2006
Posts: 457
Location: Manchester
|
 Posted: Tue Oct 09, 2018 2:20 pm Post subject: Posted: Tue Oct 09, 2018 2:20 pm Post subject: |
 |
|
| Simfit source is available on the Simfit website. |
|
| Back to top |
|
 |
DanRRight
Joined: 10 Mar 2008
Posts: 2923
Location: South Pole, Antarctica
|
 Posted: Wed Oct 10, 2018 9:09 am Post subject: Posted: Wed Oct 10, 2018 9:09 am Post subject: |
 |
|
Great. We just need the owner's confirmation that all SIMDEM sources for its DLLs can be compiled using users' own compilers and are and will be freely available or at least given to Silverfrost for their modifications.
Then Silverfrost has everything to kick the B of Matlab by creating graphics utility something like Universal Grapher to make all possible plots with just one single line of Fortran code.
To plot basic XY, 3D, Surface plot or histogram the user will just need to provide the filename for the Settings File, Data Array and its Dimension. Like here
| Code: | | call UGrapher ('Func_f_E.set', Arr(:,: ), M, N,') |
or
| Code: | | i=winio@('%ug[settings='Func_f_E.set', Arr(:,: ), M, N,') |
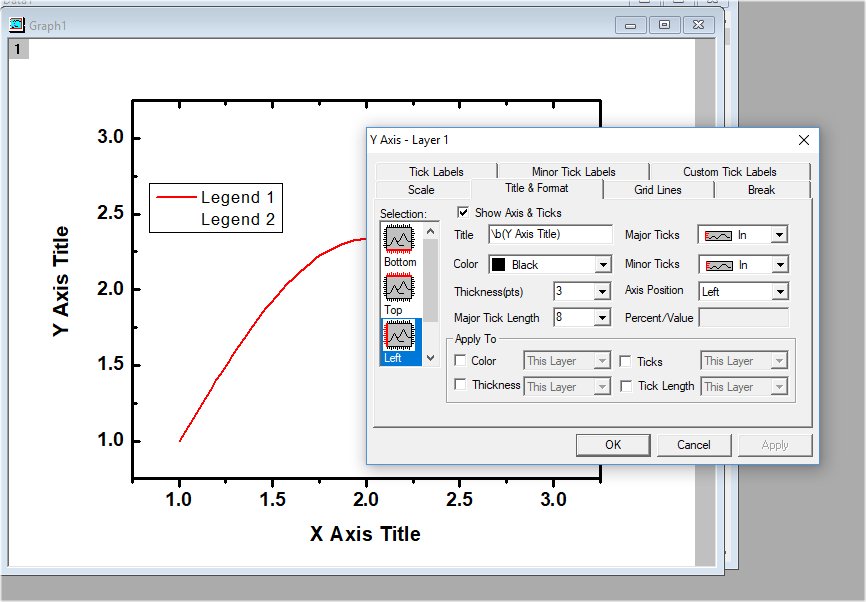
All the settings (names of axis, font sizes, data limits etc) then have to be done inside the plotter by clicking on the corner of the plot like here after which the Settings menu will popup saved automatically into Settings File "Func_f_E.set"

If user will need dynamic changes every time the plotting takes place in the running code then the user will add i=winop@ lines (like with current native %pl) which will override the settings in the Settings File. Cool? Fortran needs simple but professional plotting utility. This utility could be made universal for all existing Fortran compilers similar to how Clearwin+ was ported to them.
In the design of such UGrapher would be important to have the possibility to plot multiple graphs on the same window to create complex GUIs with many plots and controls (like airplane dashboard). BTW, I can make complex GUIs with my own graphics utilities all 100% written in FTN95 and OpenGL, but all looks not as simple as i'd wish, i mean, everything is far from one single line calling  because when i started developing them i did not know about Matlab because when i started developing them i did not know about Matlab
Last edited by DanRRight on Sat Oct 13, 2018 12:56 am; edited 1 time in total |
|
| Back to top |
|
 |
JohnCampbell
Joined: 16 Feb 2006
Posts: 2615
Location: Sydney
|
 Posted: Sun Oct 21, 2018 7:38 am Post subject: Posted: Sun Oct 21, 2018 7:38 am Post subject: |
 |
|
Dan,
How have you generated the example above? Is this an example of using %pl with a pop-up menu to edit the features you have listed, or a mock-up of where you are heading ?
If it exists, this is an impressive development for %pl that looks to be very useful.
Is there an example code that could be linked ? |
|
| Back to top |
|
 |
|


