 |
forums.silverfrost.com
Welcome to the Silverfrost forums
|
| View previous topic :: View next topic |
| Author |
Message |
DanRRight
Joined: 10 Mar 2008
Posts: 2923
Location: South Pole, Antarctica
|
 Posted: Thu Sep 18, 2014 8:00 am Post subject: Posted: Thu Sep 18, 2014 8:00 am Post subject: |
 |
|
I've done everything like it was written.
Plz post the image of same axis to compare and see if there is anything worth of trying further |
|
| Back to top |
|
 |
aebolzan
Joined: 06 Jul 2007
Posts: 229
Location: La Plata, Argentina
|
| Posted: Thu Sep 18, 2014 5:55 pm Post subject: |
|
|
using the following code:
| Code: |
Program simple
Real*8 x(100), y(100), z(100), u(100), v(100), w(100)
N=100
do i=1,N;
x(i)=i-1;
y(i)=sin(i/30.)**2;
z(i)=sin(i/30.)**5;
u(i)=sin(i/30.)**10;
v(i)=cos(i/30.)**10;
w(i)=sin(i/30.)**2 * cos(i/30.)**2;
enddo
CALL TEXTMN(0.3)
CALL AXLBJS('*C','C')
call thckmg('LINE',3.0)
call chset(20)
i=winio@('%ww%pv%pl[x_axis="Time [s]",y_axis=Amplitude,scale=log_linear,&
&title="U(red, green-analit), U_A on load(orange), I(blue, black-anal)", &
& x_array, colour=red, colour=blue, colour=green, colour=black, &
&colour=#CC8800, X_ARRAY, N_GRAPHS=5]&',&
& 300, 200, N-4, x, y, z, u, v, w)
i=winio@('%ac[esc]', 'exit')
End |
with CHSET(24) I get:
[img]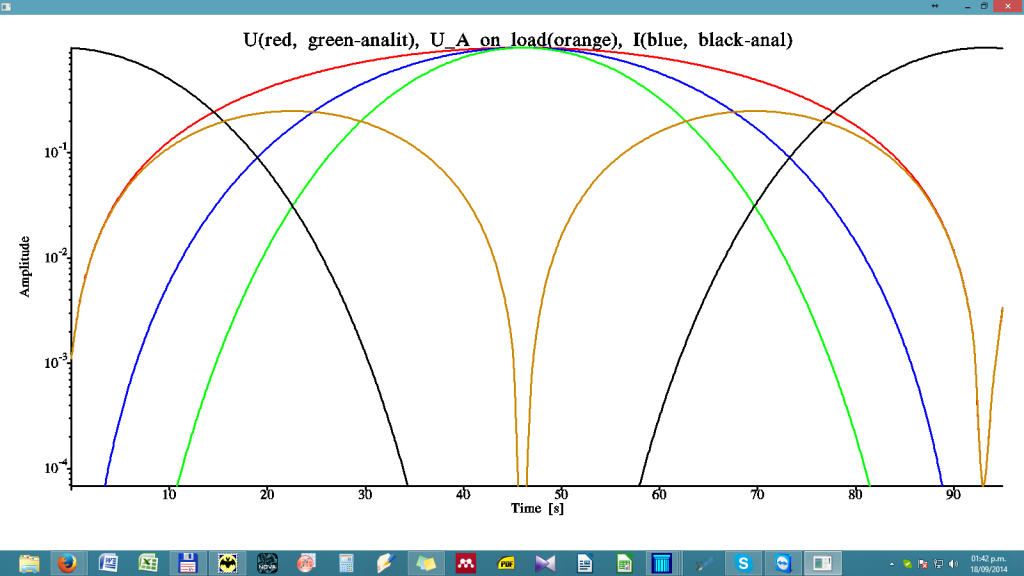 [/img][/code] [/img][/code]
and with CHSET(20)
[img]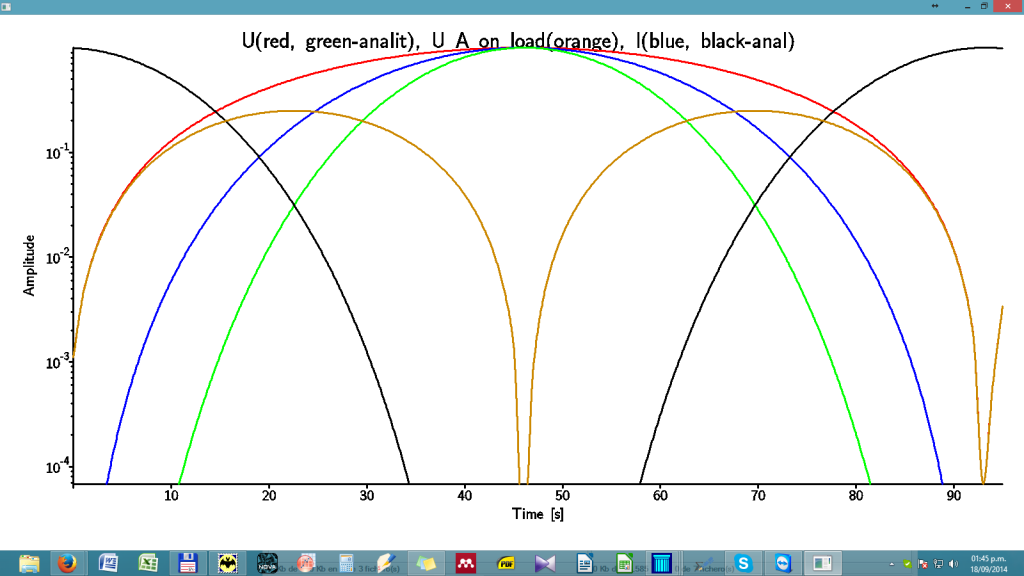 [/img] [/img]
see that I modified your original code for %pl by including a log scale in order to see the font in the case of logarithmic scales.....
As you can see the fine tunning of the plot should be done before calling %pl, almost every Simpleplot subroutine can be used before %pl to have a fine control of the plot. The Hershey fonts work as expected for Simpleplot. If you find that the font does not change by changing the argument in the CHSET subroutine, it means that either simpleplot.ini is not in your windows folder or/and hershey.dat file is not in the same folder of simpleplot.dll.
Hope this helps,
Agustin |
|
| Back to top |
|
|
aebolzan
Joined: 06 Jul 2007
Posts: 229
Location: La Plata, Argentina
|
| Posted: Thu Sep 18, 2014 8:35 pm Post subject: Re: |
|
|
| John-Silver wrote: | Hi Dan,
putting: CALL DIAGLV (0)
should eliminate the creation of the MESSAGES.TXT file.
Will upload the plot I get later when I've done a couple of variants.
John |
No, MESSAGES.TXT is a file created by Simpleplot by default and cannot be avoided (sorry Dan!). It is a diagnostic reporting file and the information included there will depend on the use or not of DIAGLV(0,1,2,3,4). If you put DIAGLV just before the call of %pl, and nothing wrong occurs, the file simply says that Simpleplot Mark 2-15 was opened. If you put DIAGLV before any call to Simpleplot subroutines, it should show every call to each subroutine or even the type of device (window, printer, etc. ) opened, if you do not use %pl, or the close of a plot or group of plots.
MESSAGES.TXT has therefore nothing to do with %pl, so that if %pl crashes is not because of the presence of that file, and the problem of a crash when trying to open the same %pl twice, is, from my point of view, a problem of %pl, not Simpleplot.
Respect to the installation of Hershey fonts, they are not installed by FTN95 because they are not included in the distribution as the Hershey.dat file was not in the hands of Silverfrost, and including it now I suspect would imply a modification of the installation procedure as it should also create and install a Simpleplot.ini file. FTN95 includes just the Simpleplot library as a kind of a present for those who needs to plot data without programming a lot, i.e. making plotting...simple. In this sense it is quite cheaper than buying a package of graphics subroutines for Fortran.....but has some limitations......at least till Mr. Silverfrost decides, or not, to update the library with the help of David Butland.....
I think that updating Simpleplot would make FTN95 an even more atractive product for customers because it would be a unique fortran compiler with the facilities of producing very nice Windows UI by means of Clearwin, and generate from simple to very complicated plotting graphs with minimum programing effort, by means of Simpleplot.
just my thoughts,
Agustin |
|
| Back to top |
|
|
DanRRight
Joined: 10 Mar 2008
Posts: 2923
Location: South Pole, Antarctica
|
| Posted: Fri Sep 19, 2014 7:03 am Post subject: |
|
|
1) Pity i have not mentioned that i changed the demo code to make exactly the same font size as in my axis example, because small and larger fonts harder to compare. Plus when post make sure that posting does not scale the image file. But anyway, the differences in these two examples exist while in any my attempts i do not see any.
2) How specifically do you compile?
3) What Windows do you use. Mine is 8.1
4) Do i need to reboot after those manipulations with installation of hershey? Probably not (and i can not reboot, too much is open on the computer)
5) any changes in environment variables?
6) please remind what makes font bold, italic and underlined
UPDATE
OK, forget all the above, i found the error. I missed preceding line with the keyword [general] being confused by the words "So I created a simple.ini file with only the statement". So the file has actually two statements and my always busy, always in the hurry, tired brain, always translating for me foreign English language too literally-- so i took just one line and omitted the less important one!
(As a sidenote, that's called NLP, neuro-linguistic programming.  All religions are based on NLP, specifically Christianity. After the Bible tells you on two-three pages hundreds of names "XXX lived 653 year and died. His son YYY lived 336 years and died. Son of his son ZZZ lived 890 years and died..." you are ready for further treatment and consumption and will believe in anything). All religions are based on NLP, specifically Christianity. After the Bible tells you on two-three pages hundreds of names "XXX lived 653 year and died. His son YYY lived 336 years and died. Son of his son ZZZ lived 890 years and died..." you are ready for further treatment and consumption and will believe in anything).
Indeed the exponent is larger, though of course the fonts look not good for all scalings, often terrible. Do you also see with font 1,2 the linewidth of plots also changes? But let's see if we find good looking font and good scaling. Yours above look not bad by the way
The only question left - please remind which option makes text bold and italic. Thanks |
|
| Back to top |
|
|
DanRRight
Joined: 10 Mar 2008
Posts: 2923
Location: South Pole, Antarctica
|
| Posted: Fri Sep 19, 2014 9:54 am Post subject: |
|
|
Thanks John,
That was another good hack! It now allows to run programs simultaneously. Multiple instances of same program are routinely running on my computer. Or just stay till i realize their results. It's like having multiple tabs in the browser.
And the advice of negative fonts was also good, i found the font which looks nice, but unfortunately it is italic. Italic layout hides pixelation of straight fonts.
Playing with Hershey rised the following obvious question:
do any antialised Hershey fonts exist in the nature? Why not, what's the problem? That would deliver high quality texts. There also exist a chance that on 4K monitors Hersheys will look without visible defects -- can anyone who has the latest tech try this source below on 4K monitors?
Here is the code for selection of best looking fonts/widths/charsets
| Code: | !--------------------------------------------------------------------
! Compilation:
!
!ftn95 aaa.for /free /debug /undef
!slink aaa.obj "c:\Program Files (x86)\Silverfrost\FTN95\SIMPLE.DLL"
!
! With thanks to Agustin "Aebolzan" and John "John-Silver"
! of the Fortran forum forums.silverfrost.com
! for bringing almost dead Simpleplot to life
!-------------------------------------------------------------------
Program simple
integer, external :: ActualPlotting
real*8 TextSize
integer LineWidth, iCharacterSetNo
common /aaa/TextSize, LineWidth, iCharacterSetNo, LWindow
TextSize = 0.41
LineWidth = 4
iCharacterSetNo=-11
i=winio@('%ww&')
i=winio@('%1tl&',16)
i=winio@('%sp&',200,250)
i=winio@('Text size %ta%df%6^rf%ff&', 1d-2, TextSize, ActualPlotting)
i=winio@('Line Width %ta%dd%6^rd%ff&', 1, LineWidth, ActualPlotting)
i=winio@('Charset (-12 to +26)%ta%dd%6^rd%ff&', 1, iCharacterSetNo, ActualPlotting)
i=winio@('%cn%^tt[Re-Plot]&',ActualPlotting)
i=winio@('%ac[esc]', 'exit')
end
!---------------------------------------------------------------------------
integer function ActualPlotting ()
real*8 TextSize
integer LineWidth, iCharacterSetNo
common /aaa/TextSize, LineWidth, iCharacterSetNo, LWindow
Real*8 x(100), y(100), z(100), u(100), v(100), w(100)
N=100
A=20000
do i=1,N;
x(i)=i-1;
y(i)=A*sin(i/30.)**2;
z(i)=A*sin(i/30.)**5;
u(i)=A*sin(i/30.)**10;
v(i)=A*cos(i/30.)**10;
w(i)=A*sin(i/30.)**2 * cos(i/30.)**2;
enddo
CALL DIAGLV (0)
CALL TEXTMN(sngl(TextSize)) ! 45)
CALL AXLBJS('*C','C')
call thckmg('LINE', float(LineWidth))
call chset(iCharacterSetNo)
LWindow = 0
call window_update@(LWindow)
i=winio@('%ww%pv%pl[x_axis="Time [s]",y_axis=Amplitude,&
&title="U(red, green-analit), U_A on load(orange), I(blue, black-anal)", &
& colour=red, colour=blue, colour=green, colour=black, &
&colour=#CC8800, X_ARRAY, SCALE=LOG_LINEAR, N_GRAPHS=5]&',&
& 900, 600, N-4, x, y, z, u, v, w)
i=winio@('%ac[esc]&', 'exit')
i=winio@('%lw', LWindow)
ActualPlotting = 2
End function |

Last edited by DanRRight on Sat Sep 20, 2014 11:48 am; edited 5 times in total |
|
| Back to top |
|
|
aebolzan
Joined: 06 Jul 2007
Posts: 229
Location: La Plata, Argentina
|
| Posted: Fri Sep 19, 2014 2:33 pm Post subject: Re: |
|
|
| John-Silver wrote: | Re- MESSAGES.TXT - well for me it worked !
I added a line with CALL DIAGLV (0) and the MESSAGES file was not produced !
|
you are right!......it seems that I put the DIAGLV call in a wrong place.....now I get the same results as you: no MESSAGES.TXT!
and very nice program Dan!.....I like your code for checking the properties of lines and fonts in a plot......I have changed your %ac for a simple %bt that just "exits" the window.....and about using antialiased Hershey fonts...well, I think the problem is not if they exist or not, but how to implement them in CHSET.....this subroutine uses the Hershey.dat file, I guess this file should be changed for that....but this is a question for.....guess who?.....David Butland!......
Agustin |
|
| Back to top |
|
|
DanRRight
Joined: 10 Mar 2008
Posts: 2923
Location: South Pole, Antarctica
|
| Posted: Fri Sep 19, 2014 7:38 pm Post subject: |
|
|
Agustin,
Just noticed that this code has some bug i couldn't immediately fix - it crashes when resized with the error message "Invalid data value supplied to %pl". Usually %pl resizes with no problem which means i made a mistake somewhere
Just the information on what's to add to %pl in future: found the article in one journal which has all figures resembling Simpleplot style.


 |
|
| Back to top |
|
|
aebolzan
Joined: 06 Jul 2007
Posts: 229
Location: La Plata, Argentina
|
| Posted: Fri Sep 19, 2014 9:32 pm Post subject: |
|
|
Dan, I do not know to what extend do you want %pl be improved.
I have not a great expertise in programming, but to me it appears that trying to make %pl a very powerful tool (with the same or similiar possibilities as Simpleplot) for making graphs would turn it into something difficult to code and at some stage difficult to understand (or follow).....I guess that using a list of calls to subroutines, each one producing some particular part of a graph, is still better, but perhaps I am wrong....probably Paul could enlighten us in this respect....
I would also say that at this stage, the use of Simpleplot under FTN95 is not straightforward as we have seen along all our discussions under this and some other topics....therefore, what I would expect, if Silverfrost considers that the inclusion of Simpleplot in the distribution is really a valuable tool, is that they:
a) include the installation of Simpleplot really as part of FTN95, i.e. the installation of Simple.ini and Hershey fonts along with the compiler.
b) include a help file for Simpleplot, as we already have for Clearwin, so that people could use it easily by accesing to the description and use of each subroutine.
c) improving Simpleplot with the help of David by updating what needs to be updated (real*8 variables?) and solving the problems with fonts (and symbols....the list of symbols in Simpleplot is not at the level of publications nowadays).
d) including the information and examples about how to use Simpleplot with Clearwin.
The main problem I see is that Silverfrost seems to be saying: "if you like, here is something called Simpleplot, but we have nothing to do with it and we will say nothing about it...", and consequently the lack of promotion to the users of FTN95 makes Simpleplot to rest in peace in the web site....until somebody starts to search for a Fortran library fro plotting graphs......and then you can go an buy something like GINOGRAF or use the free Simpleplot.....
just my thoughts,
Agustin |
|
| Back to top |
|
|
DanRRight
Joined: 10 Mar 2008
Posts: 2923
Location: South Pole, Antarctica
|
| Posted: Fri Sep 19, 2014 9:49 pm Post subject: Re: |
|
|
| aebolzan wrote: | | Dan, I do not know to what extend do you want %pl be improved... |
I want very simple thing which by the way sells from the point of view of promoting this compiler too:
1) Matlab graphics simplicity - essentially plotting in one single line of fortran text, which is already possible
2) Nature/Science/Physical Review journal quality. Matlab is capable of that, Simpleplot just needs some cosmetic work.
By the way, most of the absent features (like those on figures from journal above) can be added to %pl in a week of work without hurting its simplicity
For me any serious use of full Simpleplot will be an option if Silverfrost or all users control its source and development or have the rights to change it. Like with some other graphics packages -- Dislin or Simdem. Meantime developers at least need to fix the bugs and obvious deficiencies. Right now Simpleplot is still a dead end product (i do not know status of communications of developers) |
|
| Back to top |
|
|
DanRRight
Joined: 10 Mar 2008
Posts: 2923
Location: South Pole, Antarctica
|
| Posted: Sat Sep 20, 2014 6:57 am Post subject: |
|
|
John,
You are right, the font -11 is as good as -12 in pixelation, i missed it taking some wrong sizes. Both though have the same defect: too small font for exponent
For color #RRGGBB you need latest DLL/LIB files from version 7.1
I edited the code, the button is used just to re-plot in case you need that. Spin wheel closes windows automatically. Or esc key
Differences in scaling between my and your images are probably due to screen pixel counts dimensions of our computers. I suspect all scales will change on future 4K monitors.
As to posting images, i use Postimage dot org, ask it do not rescale and take "Direct Link" it offers. I insert it in the text same way as you do adding two img tags (same will do the forum's own button "Img" above using Javascript, so make sure it is not switched off)
Of course it will take a lot of thinking and time to make Simpleplot perfect, to add many new options, select the best ones as a default etc but to change the obvious faults with the centering tics, add standard Windows fonts, 4-axis surface area, better scalability when the size goes to thumbnail dimensions, ability to run multiple %pl windows in the same screen, fix few tic mark/labeling defects, rebuild al to 24bit color paletttes for 3D plots in demo instead of 4 bit, all probably will not take too much time, most is already done, it just sometimes looks ugly, the Simpleplot was done 20 years ago and was not updated. To make me 99% satisfied not actually very much more is needed. D.Butland perfectly knows what is wrong with the look, feel and design of Simpleplot, even his school age kids made Android graphics software Bridplot which looks absolutely amazing, have you seen that?
The way you guys discovered when full Simpleplot helps %pl to expand its functionality should be primary design concept of future Simpleplot.
Thanks for more useful tips! I added margin change to the code so anyone can adjust the margin now or just play with it (and see it like everything in Simpleplot also has room for improvement and exposes some Simpleplot defects - in my case for example adding it messes with the font for exponent decreasing it even further, axis titles jump out etc. What units are used for margin adjustment? It is definitely not the % of plotting area which is needed for proper scaling of graph if resizing). I hope you guys will find new Simpleplot bug which messes with the exponent font but opposite way and return larger exponent font back
And i found the crashing code bug when resizing - Simpleplot conflicts with %lw. Commenting this line makes it re-sizable fine but loses ability to auto-close the window
Simpleplot = huge_bugotron made in the era of unfamous FTN90, the champion of bugotrons. Needs some maintenance work ASAP
Last edited by DanRRight on Sun Sep 21, 2014 4:23 am; edited 7 times in total |
|
| Back to top |
|
|
DanRRight
Joined: 10 Mar 2008
Posts: 2923
Location: South Pole, Antarctica
|
| Posted: Sun Sep 21, 2014 1:00 am Post subject: |
|
|
| Code: | !-------------------------------------------------------
! Compilation:
!
!ftn95 aaa.for /free /debug /undef
!slink aaa.obj "c:\Program Files (x86)\Silverfrost\FTN95\SIMPLE.DLL"
!
! With thanks to Agustin "Aebolzan" and John "John-Silver"
! of the Fortran forum forums.silverfrost.com
! for bringing almost dead Simpleplot to life
!-------------------------------------------------------
Program simple
integer, external :: ActualPlotting
real*8 TextSize
integer LineWidth, iCharacterSetNo
common /aaa/TextSize, LineWidth, iCharacterSetNo, LWindow
real*8 LeftMrgn, RightMrgn, BottomMrgn, TopMrgn
common /bbb/LeftMrgn, RightMrgn, BottomMrgn, TopMrgn
TextSize = 0.41
LineWidth = 4
iCharacterSetNo=-11
LeftMrgn=2.0; RightMrgn=0.5; BottomMrgn=2.0; TopMrgn=1.0
i=winio@('%ww&')
i=winio@('%1tl&',16)
i=winio@('%sp&',50,300)
i=winio@('Text size %ta%df%6^rf%ff&', 1d-2, TextSize, ActualPlotting)
i=winio@('Line Width %ta%dd%6^rd%ff&', 1, LineWidth, ActualPlotting)
i=winio@('Charset (-12 to +26)%ta%dd%6^rd%ff&', 1, iCharacterSetNo, ActualPlotting)
i=winio@('L R B T margins %ta%df%6^rf%df%6^rf%df%6^rf%df%6^rf%ff&', 5d-1,LeftMrgn, ActualPlotting, &
5d-1,RightMrgn, ActualPlotting, 5d-1,BottomMrgn, ActualPlotting, 5d-1,TopMrgn, ActualPlotting)
i=winio@('%cn%^tt[Re-plot]&',ActualPlotting)
i=winio@('%ac[esc]', 'exit')
end
!-----------------------------------------------------
integer function ActualPlotting ()
real*8 TextSize
integer LineWidth, iCharacterSetNo
common /aaa/TextSize, LineWidth, iCharacterSetNo, LWindow
real*8 LeftMrgn, RightMrgn, BottomMrgn, TopMrgn
common /bbb/LeftMrgn, RightMrgn, BottomMrgn, TopMrgn
Real*8 x(100), y(100), z(100), u(100), v(100), w(100)
N=100
A=1 ! 20000
do i=1,N;
x(i)=i-1;
! y(i)=A*i
y(i)=A*sin(i/30.)**2;
z(i)=A*sin(i/30.)**5;
u(i)=A*sin(i/30.)**10;
v(i)=A*cos(i/30.)**10;
w(i)=A*sin(i/30.)**2 * cos(i/30.)**2;
enddo
! L R B T
CALL PICMRG(sngl(LeftMrgn),sngl(RightMrgn),sngl(BottomMrgn),sngl(TopMrgn)) ! set PICture MaRGins!
!
CALL DIAGLV (0) ! suppresses creation of MESSAGES.TXT file
CALL TEXTMN(sngl(TextSize)) ! 45)
CALL AXLBJS('*C','C')
call thckmg('LINE', float(LineWidth))
call chset(iCharacterSetNo)
LWindow = 0
call window_update@(LWindow)
i=winio@('%ww%pv%pl[x_axis="Time [s]",y_axis=Amplitude,&
&title="U(red, green-analit), U_A on load(orange), I(blue, black-anal)", &
& colour=red, colour=blue, colour=green, colour=black, &
&colour=#CC8800, X_ARRAY, SCALE=LOG_LINEAR, N_GRAPHS=5]&',&
& 900, 600, N-4, x, y, z, u, v, w)
i=winio@('%ac[esc]&', 'exit')
i=winio@('%lw&', LWindow)
i=winio@('%hw', iHWindow)
ActualPlotting = 2
End function |
|
|
| Back to top |
|
|
aebolzan
Joined: 06 Jul 2007
Posts: 229
Location: La Plata, Argentina
|
| Posted: Mon Sep 22, 2014 7:37 pm Post subject: |
|
|
well, I was thinking about the code of Dan and see that with the %pl way he has some problems with the margins and captions and also with resizing the window.....well, what I like a lot of Simpleplot is the way it works with Clearwin (I have not found how DSLIN can work with Clearwin and I guess that the good interfacing between Simpleplot and Clearwin was probably the result of a close work between BUSS and Salford in the 90'...). So, as I prefer always a Simpleplot+Clearwin solution instead of a %pl window, I modified the Dan's code to obtain a similar result but in an easier way:
see next message with the code.....just another exercise...
Agustin
Last edited by aebolzan on Mon Sep 22, 2014 7:51 pm; edited 1 time in total |
|
| Back to top |
|
|
aebolzan
Joined: 06 Jul 2007
Posts: 229
Location: La Plata, Argentina
|
| Posted: Mon Sep 22, 2014 7:50 pm Post subject: |
|
|
| Code: | module funciones
contains
integer function bitmap()
use spwin
use mswin
integer xx,yy,resize
Real*4 x(100), y(100), z(100), u(100), v(100), w(100),max_y,min_y
real*4 ymin,ymax,zmin,zmax,umin,umax,vmin,vmax,wmin,wmax
real*8 TextSize
integer LineWidth, iCharacterSetNo,iOrientation,iLineTrace
common /aaa/TextSize, LineWidth, iCharacterSetNo, LWindow,iOrientation,iLineTrace
real*8 LeftMrgn, RightMrgn, BottomMrgn, TopMrgn,PageSize_x
common /bbb/LeftMrgn, RightMrgn, BottomMrgn, TopMrgn,PageSize_x
resize=clearwin_info@('GRAPHICS_RESIZING')
IF(resize.EQ.1)THEN
xx=clearwin_info@('GRAPHICS_WIDTH')
yy=clearwin_info@('GRAPHICS_DEPTH')
HDC_DIM%iWidth = xx
HDC_DIM%iHeight = yy
HDC_DIM%iBitmapDC=clearwin_info@('GRAPHICS_DC')
endif
CALL SP_SupplyBitmap ! Pass Bitmap to SIMPLEPLOT
CALL PICMRG(sngl(LeftMrgn),sngl(RightMrgn),sngl(BottomMrgn),sngl(TopMrgn)) ! set PICture MaRGins!
CALL DIAGLV (0) ! suppresses creation of MESSAGES.TXT file
call pagvw(iOrientation)
CALL TEXTMN(sngl(TextSize))
CALL AXLBJS('*C','C')
call thckmg('LINE', float(LineWidth))
call chset(iCharacterSetNo)
N=100
do i=1,N;
x(i)=i-1;
y(i)=sin(i/30.)**2;
z(i)=sin(i/30.)**5;
u(i)=sin(i/30.)**10;
v(i)=cos(i/30.)**10;
w(i)=sin(i/30.)**2 * cos(i/30.)**2;
enddo
call limexc(y,n,ymin,ymax)!max and min values of y,z,u,v,w...
call limexc(z,n,zmin,zmax)
call limexc(u,n,umin,umax)
call limexc(v,n,vmin,vmax)
call limexc(w,n,wmin,wmax)
max_y=max(ymax,zmax,umax,vmax,wmax)
min_y=min(ymin,zmin,umin,vmin,wmin)
CALL DIAGLV (0)
call setpns(1,1,1,1)!reset the pen colours before redrawing
CALL AXLBJS('*C','C')
call axsbtk('XC','I')
call axsbtk('YC','O')
CALL SCALES(0.0,100.0,1,min_y,max_y,1)
call axes7('time','Amplitude')
CALL AXLBJS('*C','C')
call pen(1)
CALL BRKNCV(x,w,N,iLineTrace)
call pen(2)
CALL BRKNCV(x,y,N,iLineTrace)
call pen(3)
CALL BRKNCV(x,z,N,iLineTrace)
call pen(4)
CALL BRKNCV(x,u,N,iLineTrace)
call pen(5)
CALL BRKNCV(x,v,N,iLineTrace)
call updatewin
bitmap=1
end function bitmap
end module funciones
program Resized_Simpleplot_plots
!requires simpleplot.dll
use mswin
use spwin
use funciones
integer*4 ans
real*8 TextSize
integer LineWidth, iCharacterSetNo,iOrientation,iLineTrace
common /aaa/TextSize, LineWidth, iCharacterSetNo, LWindow,iOrientation,iLineTrace
real*8 LeftMrgn, RightMrgn, BottomMrgn, TopMrgn,PageSize_x
common /bbb/LeftMrgn, RightMrgn, BottomMrgn, TopMrgn,PageSize_x
external bitmap
TextSize = 0.41
LineWidth = 4
iCharacterSetNo=-11
iOrientation=2
iLineTrace=0
LeftMrgn=2.0; RightMrgn=0.5; BottomMrgn=2.0; TopMrgn=1.0
ans=winio@('%ca[A Simple Plot with Simpleplot]%bg[grey]&')
ans=winio@('Text size %ta%df%6^rf&', 1d-2, TextSize, bitmap)
ans=winio@('%2taLine Width %ta%dd%6^rd%ff&', 1, LineWidth, bitmap)
ans=winio@('Line trace (-6 to 6)%ta%dd%6^rd&',1,iLineTrace,bitmap)
ans=winio@('%2taCharset (-12 to +26)%ta%dd%6^rd%ff&', 1, iCharacterSetNo, bitmap)
ans=winio@('Orientation (2 to 7)%ta%dd%6^rd&', 1, iOrientation, bitmap)
ans=winio@('%2ta L R B T margins %ta%df%6^rf%df%6^rf%df%6^rf%df%6^rf%ff&', 5d-1,LeftMrgn, bitmap, &
5d-1,RightMrgn, bitmap, 5d-1,BottomMrgn, bitmap, 5d-1,TopMrgn, bitmap)
ans=winio@('%2nl%ww%pv%^dw[user_resize]&',800,600,bitmap) ! Pass bitmapDC to ClearWin
ans=winio@('%ff%nl%cn%6bt[Close]')
end program resized_simpleplot_plots
|
|
|
| Back to top |
|
|
DanRRight
Joined: 10 Mar 2008
Posts: 2923
Location: South Pole, Antarctica
|
| Posted: Tue Sep 23, 2014 10:42 am Post subject: |
|
|
I rewrote my program using %pl and simpleplot_redraw@.
It resizes OK. Thanks for one more trick - orientation.
| Code: | !-------------------------------------------------------------------
! Program Simple2
! Compilation:
!>ftn95 aaa.for /free /debug /undef
!>slink aaa.obj "c:\Program Files (x86)\Silverfrost\FTN95\SIMPLE.DLL"
!
! With thanks to Agustin "Aebolzan" and John "John-Silver"
! of the Fortran forum forums.silverfrost.com
! for bringing almost dead Simpleplot to life
!-------------------------------------------------------------------
!
Module SomeFun
INCLUDE <windows.ins>
real*8 TextSize
integer LineWidth, iCharacterSetNo, iOrientation, LWindow
real*8 LeftMrgn, RightMrgn, BottomMrgn, TopMrgn
Real*8 x(100), y(100), z(100), u(100), v(100), w(100)
CONTAINS
!--------------------------------------------------------------------
integer function RedrawS ()
CALL DIAGLV (0)
call pagvw(iOrientation)
! set PICture MaRGins L R B T
CALL PICMRG(sngl(LeftMrgn),sngl(RightMrgn),sngl(BottomMrgn),sngl(TopMrgn))
CALL TEXTMN(sngl(TextSize)) ! 45)
CALL AXLBJS('*C','C')
call thckmg('LINE', float(LineWidth))
call chset(iCharacterSetNo)
call simpleplot_redraw@
RedrawS = 2
End function
End Module SomeFun
!--------------------------------------------------------------------
!--------------------------------------------------------------------
Program Simple2
use SomeFun
TextSize = 0.41
LineWidth = 4
iCharacterSetNo=-11
iOrientation = 2
LeftMrgn=2.5; RightMrgn=0.5; BottomMrgn=3.0; TopMrgn=1.0
N=100
A=1 ! 20000
do i=1,N;
x(i)=i! -1;
y(i)=A*sin(i/30.)**2;
z(i)=A*sin(i/30.)**5;
u(i)=A*sin(i/30.)**10;
v(i)=A*cos(i/30.)**10;
w(i)=A*sin(i/30.)**2 * cos(i/30.)**2;
enddo
i=winio@('%ww%sy[3d_raised]&')
i=winio@('%1tl%nd%nr&',16)
i=winio@('%2.1ob[invisible,bottom_exit]&')
i=winio@('Text size %ta%df%6^rf%ff&', 1d-2, TextSize, RedrawS)
i=winio@('Line Width %ta%dd%6^rd%ff&', 1, LineWidth, RedrawS)
i=winio@('%cb&')
i=winio@('%ta Charset (-12 to +26)%ta%dd%6^rd&', &
1, iCharacterSetNo, RedrawS)
i=winio@(' Orientation (2 to 7) %dd%6^rd%ff&', &
1, iOrientation, RedrawS)
i=winio@('%ta L R B T margins %ta%df%6^rf%df%6^rf%df%6^rf%df%6^rf%ff&', &
5d-1,LeftMrgn, RedrawS, 5d-1,RightMrgn, RedrawS, &
5d-1,BottomMrgn, RedrawS, 5d-1,TopMrgn, RedrawS)
i=winio@('%cb&')
i=RedrawS()
i=winio@('%ww%pv%pl[x_axis="Time [s]",y_axis=Amplitude,&
&title="U (red), U_A (orange), I (blue) ", &
& colour=red, colour=blue, colour=green, colour=black, &
&colour=#CC8800, X_ARRAY, SCALE=LINEAR, N_GRAPHS=5]&',&
& 800, 600, N, x, y, z, u, v, w)
i=winio@('%ac[esc]%ff&', 'exit')
i=winio@('%cn%^6bt[E&xit]','exit')
End Program
|
Last edited by DanRRight on Tue Sep 23, 2014 7:21 pm; edited 2 times in total |
|
| Back to top |
|
|
aebolzan
Joined: 06 Jul 2007
Posts: 229
Location: La Plata, Argentina
|
| Posted: Tue Sep 23, 2014 1:35 pm Post subject: |
|
|
That's a nice solution, but there is one difference with mine: when you put L Margin = 1.5, I still have a correct graph and you obtain a graph where the Y-axis legend is moved to the right side of the axis (or is the axis that is moved to the left beyond the legend?......). I do not know why, but could it be another problem of %pl implementation?....but for the rest....the Simpleplot_redraw@ works fine and I like it.....
Agustin |
|
| Back to top |
|
|
|
|
You cannot post new topics in this forum
You cannot reply to topics in this forum
You cannot edit your posts in this forum
You cannot delete your posts in this forum
You cannot vote in polls in this forum
|
Powered by phpBB © 2001, 2005 phpBB Group
|


