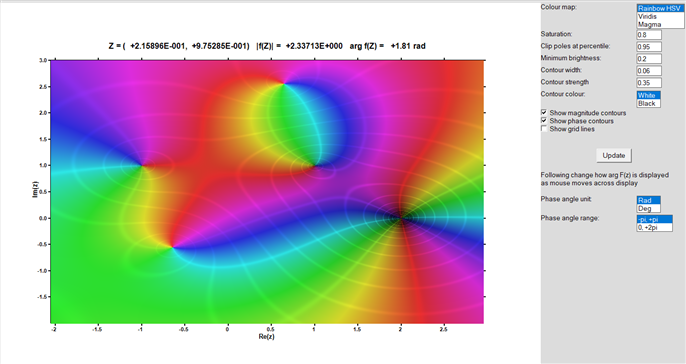
The domain_plot_mod module provides an interactive ClearWin+–based visualization tool for complex-valued functions over a two-dimensional real domain. Given strictly monotonic real coordinate arrays x and y (not necessarily uniform) and a sampled complex field z(x,y), the subroutine DOMAIN_PLOT(x,y,z) renders a phase–magnitude domain plot in which amplitude is mapped to perceptual brightness, and phase is overlaid through hue (for HSV) or optional contour structures. The code performs preprocessing including safe logarithmic scaling of magnitudes, adaptive percentile-based clipping to control extreme poles, and bilinear interpolation of amplitude and phase using unit-circle projections to avoid angular discontinuities. Rendering is handled pixel-by-pixel via a plotting callback, supporting multiple colour maps (Rainbow/HSV, Viridis, and Magma), adjustable saturation and brightness floors, optional magnitude and phase contours blended toward white or black, and interactive mouse readout of complex values with selectable angle units and ranges. The design emphasizes perceptual clarity and interactive exploration of complex function behaviour while remaining efficient and compatible with native ClearWin+ graphics primitives.
module domain_plot_mod
use clrwin
implicit none
private
public domain_plot
real*8, allocatable :: xc(:), yc(:), amp(:,:), phase(:,:), &
                      zabslog1psorted(:), ccos(:,:), csin(:,:)
real*8, parameter :: pi = 4.d0*atan(1.d0), twopi = 2.d0*pi
real*8, parameter :: halfpi = 0.5d0*pi, rec2pi = 1.d0/(2.d0*pi)
real*8, parameter :: rad2deg = 180.d0/pi
real*8, parameter :: log2 = log(2.d0), reclog2 = 1.d0/log2
real*8 :: xmin, xmax, ymin, ymax, zabsmin, zabsmax
integer :: screen_width, screen_depth, graphics_width, graphics_depth
integer :: mleft, mtop, mright, mbottom, fleft, ftop, fright, fbottom
integer :: frame_center_x, frame_width
integer :: show_mag_contours, show_phase_contours,show_grid_lines
real*8 ::  perc, sat, v_min, width, strength
logical :: first_plot_adjust
integer :: menu_on = 1
character(len=5), parameter :: contour_colour(2) = ['White','Black']
integer :: contour_colour_selected = 1
character(len=5), parameter :: phase_angle(2) = ['Rad  ','Deg  ']
integer :: phase_angle_selected = 1
character(len=8), parameter ::phase_angle_range(2) = ['-pi, +pi','0, +2pi ']
integer :: phase_angle_range_selected = 1
character(len=11), parameter :: colour_map(4) = ['Rainbow HSV','Viridis    ',&
                   'Magma      ','Turbo      ']
integer :: colour_map_selected = 1

! --------------------------------------------------------------------
! Viridis colormap
! Source: Matplotlib (Stefan van der Walt, Nathaniel Smith, Eric Firing)
! Licence: CC0 1.0 Universal (public domain, no restrictions)
! --------------------------------------------------------------------
real*8, parameter :: viridis18(18,3) = reshape([ &
    ! R column (18)
    0.267004,0.281924,0.280255,0.263663,0.237441,0.208623,&
    0.182256,0.159194,0.137770,0.121148,0.128087,0.180653,&
    0.274149,0.395174,0.535621,0.688944,0.845561,0.993248,&
    ! G column (18)
    0.004874,0.089666,0.165693,0.237631,0.305202,0.367752,&
    0.426184,0.482237,0.537492,0.592739,0.647749,0.701402,&
    0.751988,0.797475,0.835785,0.865448,0.887322,0.906157,&
    ! B column (18)
    0.329415,0.412415,0.476498,0.518762,0.541921,0.552675,&
    0.557120,0.558073,0.554906,0.544641,0.523491,0.488189,&
    0.436601,0.367757,0.281908,0.182725,0.099702,0.143936],[18,3])

! --------------------------------------------------------------------
! Magma colormap
! Source: Matplotlib (Stefan van der Walt, Nathaniel Smith, Eric Firing)
! Licence: CC0 1.0 Universal (public domain, no restrictions)
! --------------------------------------------------------------------
real*8, parameter :: magma18(18,3) = reshape([ &
    ! R column (18)
    0.001462,0.035520,0.102815,0.191460,0.291366,0.384299,&
    0.475780,0.569172,0.664915,0.761077,0.852126,0.925937,&
    0.969680,0.989363,0.996580,0.996727,0.992440,0.987053,&
    ! G column (18)
    0.000466,0.028397,0.063010,0.064818,0.064553,0.097855,&
    0.134577,0.167454,0.198075,0.231214,0.276106,0.346844,&
    0.446936,0.557873,0.668256,0.776795,0.884330,0.991438,&
    ! B column (18)
    0.013866,0.125209,0.257854,0.396152,0.475462,0.501002,&
    0.507921,0.504105,0.488836,0.460162,0.418573,0.374959,&
    0.360311,0.391671,0.456192,0.541039,0.640099,0.749504],[18,3])

! --------------------------------------------------------------------
! Turbo colourmap (Google, 2019)
! Source: Anton Mikhailov, Google AI Blog
! Licence: Apache 2.0 (permissive, attribution recommended)
! 18-sample turbo, arranged as R-block, then G-block, then B-block
! --------------------------------------------------------------------
real*8, parameter :: turbo18(18,3) = reshape([ &
  ! R column (18)
  0.189950,0.248300,0.275090,0.268780,0.186250,0.100260, &
  0.135260,0.320060,0.546580,0.715770,0.858680,0.960490, &
  0.996540,0.975450,0.910240,0.807990,0.664490,0.479600, &
  ! G column (18)
  0.071760,0.241430,0.400720,0.549950,0.697750,0.829550, &
  0.921970,0.979740,0.999070,0.968750,0.886550,0.771810, &
  0.631930,0.457400,0.295990,0.177530,0.084360,0.015830, &
  ! B column (18)
  0.232170,0.612860,0.866920,0.993030,0.954980,0.813890, &
  0.665560,0.476540,0.295810,0.208150,0.212300,0.228110, &
  0.187380,0.113050,0.048140,0.016600,0.004240,0.010550 ], [18,3])

contains

  subroutine domain_plot(x,y,z)
  real*8, intent(in) :: x(:)
  real*8, intent(in) :: y(:)
  complex*16, intent(in) :: z(:,:)
  integer :: i, j, k, nx, ny, iw
  logical :: ismonotonicinc
    nx = size(x) ; ny = size(y)
    if (size(z,dim=1) .ne. nx .or. size(z,dim=2) .ne. ny) &
      STOP 'Non-conformant arrays in call to DOMAIN_PLOT'
    ! Check that x and y are strictly monotonic increasing
    ismonotonicinc = .true.
    do i = 1, nx -1
      if (x(i+1) <= x(i)) then
        ismonotonicinc = .false.
        exit
      end if
    end do
    if (ismonotonicinc) then
      do j = 1, ny-1
        if (y(j+1) <= y(j)) then
          ismonotonicinc = .false.
          exit
        end if
      end do
    end if
    if (.not. ismonotonicinc) then
      print*, 'DOMAIN_PLOT: x and/or y are not strictly monotonic increasing'
      return
    end if
    ! Allocate storage arrays
    if (allocated(xc))    deallocate(xc)
    if (allocated(yc))    deallocate(yc)
    if (allocated(amp))   deallocate(amp)
    if (allocated(phase)) deallocate(phase)
    if (allocated(zabslog1psorted)) deallocate(zabslog1psorted)
    if (allocated(ccos))  deallocate(ccos)
    if (allocated(csin))  deallocate(csin)

    allocate (xc(nx),yc(ny),amp(nx,ny),phase(nx,ny),zabslog1psorted(nx*ny),ccos(nx,ny),csin(nx,ny))
    xmin = x(1) ; xmax = x(nx) ; ymin = y(1) ; ymax = y(ny)
    ! Copy arguments x and y to global module arrays xc and yc to make
    ! them accessible later
    xc = x ; yc = y
    ! Do some preprocessing before the pl callback
    zabsmin = huge(1.d0)
    zabsmax = 0.d0
    k = 0
    do j = 1, ny
      do i = 1, nx
        amp(i,j)  = abs(z(i,j))
        zabsmin = min( zabsmin, amp(i,j) )
        zabsmax = max( zabsmax, amp(i,j) )
        if (amp(i,j) > 1.0d-300) then
          phase(i,j) = atan2(aimag(z(i,j)), real(z(i,j)))
        else
          ! Avoid "starbust"
          phase(i,j) = phase(max(1,i-1),max(1,j-1))
        end if
        ! Projections onto the unit circle
        ccos(i,j) = cos(phase(i,j))
        csin(i,j) = sin(phase(i,j))
        ! Flatten log(1+|Z|) into vector - sorted later
        k = k + 1
        zabslog1psorted(k) = safe_log1p(amp(i,j))
      end do
    end do
    ! Sort zabslog1psorted once, so don't need to do again if
    ! percentile cut off changed
    call quicksort(zabslog1psorted)

    if (zabsmax > zabsmin) then
      ! Prevent first render being performed before the window appears
      first_plot_adjust = .true.
      screen_width = clearwin_info@('SCREEN_WIDTH')
      screen_depth = clearwin_info@('SCREEN_DEPTH')
      graphics_width = int(0.6d0*dble(screen_width))
      graphics_depth = int(0.7d0*dble(screen_depth))
      call calc_pl_margins(graphics_width, graphics_depth, mleft, mtop, mright, mbottom)
      ! Default pl margins are relatively large for large regions, reduce by 2/3
      mleft   = 2*mleft/3
      mtop    = 2*mtop/3
      mright  = 2*mright/3
      mbottom = 2*mbottom/3
      ftop    = mtop
      fbottom = graphics_depth - mbottom
      fleft   = mleft
      fright  = graphics_width - mright
      frame_width    = graphics_width - mleft - mright
      frame_center_x = mleft + frame_width/2
      ! Set default plotting parameters
      show_mag_contours = 1
      show_phase_contours = 1
      show_grid_lines = 0
      sat  = 0.8d0
      v_min = 0.2d0
      width = 0.06d0
      strength = 0.35d0
      ! Choose good percentile value for pole clipping using adaptpercentile
      perc = adaptpercentile(zabslog1psorted)

      iw = winio@('%ww[no_sysmenu]&')
      iw = winio@('%mn[~Exit]&',menu_on,'exit')
      iw = winio@('%mn[~Help]&',menu_on,help_cb)
      iw = winio@('%fn[Arial]%ts%bf%bg&',1.2d0,rgb@(220,220,220))
      call winop@('%pl[native, n_graphs=1,x_array,frame,link=user,external_ticks]')
      call winop@('%pl[axes_pen=2,frame_pen=2,xaxis="Re(z)",yaxis="Im(z)"]')
      call winop@('%pl[full_mouse_input,gridlines]')
      call winop_flt@('%pl[x_min]',xmin)
      call winop_flt@('%pl[x_max]',xmax)
      call winop_flt@('%pl[y_min]',ymin)
      call winop_flt@('%pl[y_max]',ymax)
      call set_pl_margins(mleft, mtop, mright, mbottom)
      iw = winio@('%2.1ob[invisible]&')
      iw = winio@('%^pl&',graphics_width,graphics_depth,2,[0.d0,1.d0],[0.d0,1.d0],pl_cb)
      iw = winio@('%cb&')
      iw = winio@('%sf&')
      iw = winio@('%fl&',0.d0,1.d0)
      iw = winio@('Colour map:%ta%ta%`bg[white]%ls%ff&', &
            colour_map, 4, colour_map_selected)
      iw = winio@('Saturation:%ta%ta%`bg[white]%6rf%nl&',sat)
      iw = winio@('Clip poles at percentile:%ta%`bg[white]%6rf%nl&',perc)
      iw = winio@('Minimum brightness:%ta%ta%`bg[white]%6rf%nl&',v_min)
      iw = winio@('Contour width:%ta%ta%`bg[white]%6rf%nl&',width)
      iw = winio@('Contour strength%ta%ta%`bg[white]%6rf%nl&',strength)
      iw = winio@('Contour colour:%ta%ta%`bg[white]%ls%ff&',contour_colour,2,contour_colour_selected)
      iw = winio@('%`fl&')
      iw = winio@('%`rb[Show magnitude contours]%nl&',show_mag_contours)
      iw = winio@('%`rb[Show phase contours]%nl&',show_phase_contours)
      iw = winio@('%`rb[Show grid lines]%nl&',show_grid_lines)
      iw = winio@('%2nl%cn%~^bn[Update]%2nl&',menu_on,update_cb)
      iw = winio@('Following change how arg F(z) is displayed%nlas mouse moves across display%2nl&')
      iw = winio@('Phase angle unit:%ta%ta%`bg[white]%ls%ff&',phase_angle,2,phase_angle_selected)
      iw = winio@('Phase angle range:%ta%ta%`bg[white]%ls%ff&',phase_angle_range,2,phase_angle_range_selected)
      iw = winio@('%cb&')
      iw = winio@('%sc&',sc_cb)
      iw = winio@('')
    else
      print*, 'Domain_plot: Input is level plane.'
    end if
  end subroutine domain_plot

  !----------------------------------------------------------------
  integer function sc_cb()
  !----------------------------------------------------------------
    first_plot_adjust = .false.
    sc_cb = update_cb()
  end function sc_cb

  !----------------------------------------------------------------
  integer function update_cb()
  !----------------------------------------------------------------
    call set_cursor_waiting@(1)
    call simpleplot_redraw@()
    call set_cursor_waiting@(0)
    update_cb = 2
  end function update_cb

  !----------------------------------------------------------------
  recursive integer function pl_cb()
  !----------------------------------------------------------------
  integer :: i, j, k, icol
  integer :: mouse_x, mouse_y
  real*8 :: x, y, r, h
  real*8 :: red, green, blue, t, f, d, line
  real*8 :: target_phase, fphase
  real*8 :: v, scale_factor
  real*8 :: mag, angle, xperc, recw2, v_target
  integer :: text_x, text_y, tw, th, idx, npoints
  integer(2) :: i2, j2
  integer :: val
  real*8, parameter :: ref_mag = 1000.d0
  real*8, parameter :: width_min = 1.0d-6
  character(len=256) ::clearwin_string@, cb_reason
  character(len=512) ::data_string
  character(len=*), parameter :: fmt1 = '( &
            & "Z = (",1X,SP,ES14.5E3,",",1X,SP,ES14.5E3,")",3X, &
            & "|f(Z)| =",1X,SP,ES14.5E3,3X, &
            & "arg f(Z) =",1X,SP,F7.2,1X,"rad")'
  character(len=*), parameter :: fmt2 = '( &
            & "Z = (",1X,SP,ES14.5E3,",",1X,SP,ES14.5E3,")",3X, &
            & "|f(Z)| =",1X,SP,ES14.5E3,3X, &
            & "arg f(Z) =",1X,SP,F7.1,1X,"deg")'
  logical, save :: pl_cb_active = .false.
  logical, save :: first = .true.
  integer,save :: iwhite, iblack

    if (pl_cb_active) then
      pl_cb = 2
      return
    end if

    if (first) then
      iwhite = rgb@(255,255,255)
      iblack = rgb@(0,0,0)
      first = .false.
    end if

    pl_cb_active = .true.
    menu_on = 0
    cb_reason = clearwin_string@('CALLBACK_REASON')

    if (cb_reason .eq. 'RESIZE') then

      pl_cb_active = .false.
      menu_on = 1
      pl_cb=2
      return

    else if (cb_reason .eq. 'MOUSE_MOVE') then

      mouse_x = clearwin_info@('GRAPHICS_MOUSE_X')
      mouse_y = clearwin_info@('GRAPHICS_MOUSE_Y')

      call draw_filled_rectangle@(0, int(0.9d0*dble(mtop)), graphics_width,0, iwhite)

      if (mouse_x .ge. fleft .and. mouse_x .le. fright .and. &
          mouse_y .ge. ftop  .and. mouse_y .le. fbottom)    then

        k = get_plot_data@(mouse_x,mouse_y,x,y)

        if (k == 0 .and. x >= xmin .and. x <= xmax .and. y >= ymin .and. y <= ymax) then
          call z_rh_bilinear(x,y,mag,angle)
          if (phase_angle_range_selected .eq. 2) then
            if (angle < 0.d0) angle = angle + twopi
          end if
          if (phase_angle_selected .eq. 1) then
            write(data_string,fmt1) x, y, mag, angle
          else
            write(data_string,fmt2) x, y, mag, angle*rad2deg
          end if
          call get_text_size@(trim(adjustl(data_string))//char(0), tw, th)
          text_x = frame_center_x - tw/2
          text_y = ftop - th - 20    ! small gap above frame
          call draw_characters@(data_string, text_x, text_y, iblack)
        end if
      end if
      pl_cb_active = .false.
      menu_on = 1
      pl_cb=2
      return

    else if (cb_reason .eq. 'PLOT_ADJUST') then

      if (first_plot_adjust) then
        pl_cb_active = .false.
        pl_cb = 2
        return
      end if

      npoints = size(zabslog1psorted)
      idx = max(1, min(npoints, nint(perc * dble(npoints))))
      xperc = zabslog1psorted(idx)
      xperc = exp(xperc) - 1.d0
      ! Guard against zero percentile
      scale_factor = 1.d0
      if (xperc > 0.d0) scale_factor = ref_mag / xperc

      recw2 = 1.d0/(width*width)
      !set v_target for contour colours
      if (contour_colour_selected .eq. 1) then
        ! White
        v_target = 1.d0
      else
        ! Black
        v_target = 0.d0
      end if

      ! Render the surface

      do i = fleft, fright, 1
        do j = fbottom, ftop, -1
          k = get_plot_data@(i,j,x,y)
          ! Don't draw over grid lines if show_grid_lines = 1
          if (show_grid_lines .eq. 1) then
            i2 = i ; j2 = j
            call get_rgb_value@(i2,j2,val)
            if (val .ne. iwhite) cycle
          end if

          ! Interpolate amplitude and phase
          call z_rh_bilinear(x,y,r,h)
          h = (h + pi) * rec2pi
          h = h - floor(h)
          r = r*scale_factor

          ! Base brightness from amplitude
          v = 1.d0 - 1.d0/(1.d0 + safe_log1p(r))
          !!v = safe_log1p(r) / safe_log1p(r + 1.d0)
          v = max(v, v_min)

          ! Magnitude contours (white or black rings)
          if (show_mag_contours == 1) then
            if (r > 0.d0 .and. width > width_min) then
                t = log(r)*reclog2
                f = t - floor(t)
                d = min(f, 1.d0 - f)
                line = exp(-d*d*recw2)
                ! Blend towards selected contour colour
                  v = v + (v_target - v)*line*strength
            end if
          end if

          ! Phase contours (white or black lines)
          if (show_phase_contours == 1 .and. width .gt. width_min) then
              do k = 0, 3
                target_phase = halfpi*dble(k)
                fphase = abs(h*twopi - target_phase)
                if (fphase > pi) fphase = twopi - fphase
                line = exp(-fphase*fphase*recw2)
                ! Blend towards selected contour colour
                  v = v + (v_target - v)*line*strength
            end do
          end if

          ! Final clamp of brightness
          v = min(1.d0, max(v_min, v))

          ! Convert HSV or V to RGB depending on selected colour map
          select case(colour_map_selected)
            case(1) ; call hsv_to_rgb(h, sat, v, red, green, blue)
            case(2) ; call cmap_rgb(viridis18,v, red, green, blue)
            case(3) ; call cmap_rgb(magma18,v, red, green, blue)
            case(4) ; call cmap_rgb(turbo18,v, red, green, blue)
          end select

          icol = rgb@(int(255.d0*red), int(255.d0*green), int(255.d0*blue))
          ! Draw pixels using draw_filled_rectangle@
          call draw_filled_rectangle@(i,j,i,j,icol)
        end do
        if (mod(i,2) == 0) call temporary_yield@()
      end do
      menu_on = 1
      pl_cb_active = .false.
      pl_cb = 2
      return
    end if
    ! Defensive, should never get here
    menu_on = 1
    pl_cb_active = .false.
    pl_cb = 2
  end function pl_cb

  !----------------------------------------------------------------
  subroutine z_rh_bilinear(xt, yt, r, h)
  !----------------------------------------------------------------
  real*8, intent(in)  :: xt, yt
  real*8, intent(out) :: r, h
  integer, save:: i=1, j=1
  real*8 :: x1, x2, y1, y2, tx, ty
  real*8 :: c, s, rrr
  ! Uses global arrays yc, xc, amp, ccos, csin
    ! Locate cell
    i  = bin_search2(xc, xt, i)     ;  j  = bin_search2(yc, yt, j)
    x1 = xc(i)  ;  x2 = xc(i+1) ;  y1 = yc(j)  ;  y2 = yc(j+1)
    tx = (xt - x1) / (x2 - x1)  ;  ty = (yt - y1) / (y2 - y1)
    ! Bilinear interpolation of amplitude
    r = (1.d0-tx)*(1.d0-ty)*amp(i,  j  ) + tx*(1.d0-ty)*amp(i+1,j  ) + &
        (1.d0-tx)*(ty     )*amp(i,  j+1) + tx*(ty     )*amp(i+1,j+1)
    ! Bilinear interpolation on unit circle
    c = (1.d0-tx)*(1.d0-ty)*ccos(i,  j  ) + tx*(1.d0-ty)*ccos(i+1,j  ) + &
        (1.d0-tx)*(ty     )*ccos(i,  j+1) + tx*(ty     )*ccos(i+1,j+1)
    s = (1.d0-tx)*(1.d0-ty)*csin(i,  j  ) + tx*(1.d0-ty)*csin(i+1,j  ) + &
        (1.d0-tx)*(ty     )*csin(i,  j+1) + tx*(ty     )*csin(i+1,j+1)
    ! Normalise and recover phase
    rrr = hypot(c,s)
    h = 0.d0
    if (rrr > 0.d0) h = atan2(s/rrr, c/rrr)
  end subroutine z_rh_bilinear

  !----------------------------------------------------------------
  subroutine hsv_to_rgb(h, s, v, r, g, b)
  !----------------------------------------------------------------
  real*8, intent(in) :: h, s, v
  real*8, intent(out) :: r, g, b
  real*8 :: i, f, p, q, t
    i = floor(6.d0*h) ; f = 6.d0*h - i
    p = v*(1.d0 - s)  ; q = v*(1.d0 - f*s)
    t = v*(1.d0 - (1.d0-f)*s)
    select case (mod(int(i),6))
      case (0); r=v; g=t; b=p
      case (1); r=q; g=v; b=p
      case (2); r=p; g=v; b=t
      case (3); r=p; g=q; b=v
      case (4); r=t; g=p; b=v
      case (5); r=v; g=p; b=q
    end select
  end subroutine hsv_to_rgb

  !----------------------------------------------------------------
  subroutine calc_pl_margins(width, height, left, top, right, bottom)
  !----------------------------------------------------------------
  integer, intent(in) :: width, height
  integer, intent(out) :: left, top, right, bottom
  integer :: m, hoffset, voffset
    m = max( 28, int(0.1d0 * max(width, height)) )
    bottom = m ;         right  = m
    hoffset = m / 2 ;    voffset = 0
    left = m + hoffset ; top  = m + voffset
  end subroutine calc_pl_margins

  !----------------------------------------------------------------
  subroutine quicksort(a)
  !----------------------------------------------------------------
  ! Textbook recursive quicksort
  !----------------------------------------------------------------
  real*8, intent(inout) :: a(:)
    call qs(a, 1, size(a))
    contains
    recursive subroutine qs(a, left, right)
    real*8, intent(inout) :: a(:)
    integer, intent(in) :: left, right
    integer :: i, j
    real*8 :: pivot, tmp
      if (left >= right) return
      pivot = a((left+right)/2)
      i = left ; j = right
      do
        do while (a(i) < pivot)
          i = i + 1
        end do
        do while (a(j) > pivot)
          j = j - 1
        end do
        if (i <= j) then
          tmp = a(i) ; a(i) = a(j) ; a(j) = tmp
          i = i + 1 ; j = j - 1
        end if
        if (i > j) exit
      end do
      call qs(a, left, j)
      call qs(a, i, right)
    end subroutine qs
  end subroutine quicksort

  !----------------------------------------------------------------
  real*8 function safe_log1p(x)
  !----------------------------------------------------------------
  ! Returns log(1+x) safely for x > -1
  !----------------------------------------------------------------
  real*8, intent(in) :: x
  real*8 :: ax
  real*8, parameter :: x_tiny = sqrt(epsilon(1.d0))
    ax = abs(x)
    if (x <= -1.d0) then
      safe_log1p = -huge(1.d0)
    else if (ax < x_tiny) then
      safe_log1p = x*(1.d0 - x*(0.5d0 - x*(1.d0/3.d0)))
    else if (x > huge(1.d0)/2.d0) then
      safe_log1p = log(x)
    else
      safe_log1p = log(1.d0 + x)
    end if
  end function safe_log1p

  real*8 function adaptpercentile(zlog)
  !-------------------------------------------------------------------
  ! Compute an adaptive percentile for amplitude clipping
  ! Input:  zlog(:) = log1p(abs(z)) sorted ascending
  ! Output: adaptive_percentile = suggested percentile [0,1]
  !-----------------------------------------------------------------------
  ! Tail Ratio           Interpretation                  Adaptive
  ! (q99-q50)/(q95-q50)                                  percentile
  !-----------------------------------------------------------------------
  ! < 0.5                Very light tail                 0.99
  ! < 1.0                Light tail, mild outliers       0.97
  ! < 2.0                Moderate tail                   0.95
  ! < 4.0                Heavy tail                      0.92
  ! >= 4.0               Extreme tail (very large poles) 0.90
  !-----------------------------------------------------------------------
  real*8, intent(in) :: zlog(:)
  integer :: n
  real*8 :: q50, q95, q99, tail_ratio
  real*8, parameter :: default_perc = 0.95d0
    n = size(zlog)
    if (n < 10) then
      ! Too few points, fallback
      adaptpercentile = default_perc
      return
    end if
    ! Fetch percentile values
    q50 = zlog(max(1, min(n, nint(0.50d0 * dble(n)))))
    q95 = zlog(max(1, min(n, nint(0.95d0 * dble(n)))))
    q99 = zlog(max(1, min(n, nint(0.99d0 * dble(n)))))
    ! Guard against degenerate cases
    if (q95 <= q50) then
      adaptpercentile = 0.95d0
      return
    end if
    ! Tail ratio: how far the extreme tail is from the bulk
    tail_ratio = (q99 - q50) / (q95 - q50)
    ! Map tail_ratio to adaptive percentile
    if (tail_ratio < 0.5d0) then
      adaptpercentile = 0.99d0
    else if (tail_ratio < 1.0d0) then
      adaptpercentile = 0.97d0
    else if (tail_ratio < 2.0d0) then
      adaptpercentile = 0.95d0
    else if (tail_ratio < 4.0d0) then
      adaptpercentile = 0.92d0
    else
      adaptpercentile = 0.90d0
    end if
  end function adaptpercentile

  !----------------------------------------------------------------
  subroutine cmap_rgb(cmap,t, r, g, b)
  !----------------------------------------------------------------
  real*8, intent(in) :: cmap(:,:)
  real*8, intent(in)  :: t        ! 0 <= t <= 1
  real*8, intent(out) :: r, g, b
  integer :: n, i
  real*8 :: x, w
    n = size(cmap, dim=1)
    x = max(0.d0, min(1.d0, t)) * dble(n-1)
    i = int(x) + 1
    w = x - dble(i-1)
    if (i >= n) then
      r = cmap(n,1)
      g = cmap(n,2)
      b = cmap(n,3)
    else
      r = (1.d0-w)*cmap(i,1) + w*cmap(i+1,1)
      g = (1.d0-w)*cmap(i,2) + w*cmap(i+1,2)
      b = (1.d0-w)*cmap(i,3) + w*cmap(i+1,3)
    end if
  end subroutine cmap_rgb

  !----------------------------------------------------------------
  integer function bin_search2(xx, x, jlo0) result(jlo)
  !----------------------------------------------------------------
  ! An accelerated bracket search that exploits locality to
  ! outperform binary search on correlated queries
  !----------------------------------------------------------------
  real*8, intent(in) :: xx(:), x
  integer, intent(in) :: jlo0
  integer :: n, inc, jhi, jm
  logical :: ascnd
  real*8  :: xlo, xhi
    n   = size(xx)
    xlo = xx(1)
    xhi = xx(n)
    ascnd = (xhi >= xlo)
    jlo = jlo0
    if (jlo >= 1 .and. jlo < n) then
       if (ascnd) then
          if (x >= xx(jlo) .and. x < xx(jlo+1)) return
       else
          if (x <= xx(jlo) .and. x > xx(jlo+1)) return
       end if
    end if
    if (jlo <= 0 .or. jlo > n) then
       jlo = 0
       jhi = n + 1
    else
       inc = 1
       if (ascnd) then
          if (x >= xx(jlo)) then
             do
                jhi = jlo + inc
                if (jhi > n) then
                   jhi = n + 1
                   exit
                end if
                if (x >= xx(jhi)) then
                   jlo = jhi
                   inc = inc + inc
                else
                   exit
                end if
             end do
          else
             jhi = jlo
             do
                jlo = jhi - inc
                if (jlo < 1) then
                   jlo = 0
                   exit
                end if
                if (x < xx(jlo)) then
                   jhi = jlo
                   inc = inc + inc
                else
                   exit
                end if
             end do
          end if
       else
          if (x <= xx(jlo)) then
             do
                jhi = jlo + inc
                if (jhi > n) then
                   jhi = n + 1
                   exit
               end if
                 if (x <= xx(jhi)) then
                   jlo = jhi
                   inc = inc + inc
                else
                   exit
                end if
             end do
          else
             jhi = jlo
             do
                jlo = jhi - inc
                if (jlo < 1) then
                   jlo = 0
                   exit
                end if
                if (x > xx(jlo)) then
                   jhi = jlo
                   inc = inc + inc
                else
                   exit
                end if
             end do
          end if
       end if
    end if
    do while (jhi - jlo > 1)
       jm = (jhi + jlo) / 2
       if (ascnd) then
          if (x >= xx(jm)) then
             jlo = jm
          else
            jhi = jm
           end if
       else
          if (x <= xx(jm)) then
             jlo = jm
          else
             jhi = jm
          end if
       end if
    end do
    ! If outside range, clamp to last valid index
    jlo = max(1, min(size(xx)-1, jlo))
  end function bin_search2

  !----------------------------------------------------------------
  subroutine set_pl_margins(L,T,R,B)
  !----------------------------------------------------------------
  integer, intent(in) :: L,T,R, B
  character(len=120) :: margintxt
  character(len=*), parameter :: fmt1 = '(A,I4,A,I4,A,I4,A,I4,A)'
    write(margintxt,fmt1) "%pl[margin=(",L,",",T,",",R,",",B,")]"
    call winop@(margintxt)
  end subroutine set_pl_margins

  !----------------------------------------------------------------
  integer function help_cb()
  !----------------------------------------------------------------
  integer :: iw
    iw = winio@('%fn[Arial]%ts%bg&',1.2d0,rgb@(220,220,220))
    iw = winio@('%ob%~bg[white]&')
    iw = winio@('Colour map allows you to selection standard Rainbow/HSV colour map,%nl&')
    iw = winio@('or the perceptually uniform colour maps Viridis or Magma, and also Turbo.%2nl&')
    iw = winio@('Viridis, Magma and Turbo do not display phase angle in the pixel rendering.%2nl&')
    iw = winio@('Increasing saturation increases color intensity (for rainbow/HSV only).%2nl&')
    iw = winio@('Increasing minimum brightness raises the darkest pixels.%2nl&')
    iw = winio@('Changing percentile changes the clipping of extreme amplitudes.%2nl&')
    iw = winio@('Adjusting contour width changes the width of magnitude/phase rings.%2nl&')
    iw = winio@('Contours can be blended towards a base white or black in Rainbow/HSV.%2nl&')
    iw = winio@('Checking/unchecking contours toggles them on/off%2nl&')
    iw = winio@('Checking/unchecking grid lines draws/erases the grid%nl%cb&')
    iw = winio@('')
    help_cb = 2
  end function help_cb

end module domain_plot_mod
Below is a sample program which demonstrates the use of the code.
program test_domain_plot
use domain_plot_mod, only : domain_plot
implicit none
integer, parameter :: dp = kind(1.d0)
integer, parameter :: n = 300
integer :: i, j
real(dp) :: re_z(n), im_z(n)
complex(dp) :: f(n,n), z_temp, cj
  cj = cmplx(0.d0,1.d0,kind=dp)

  ! Generate a test function
  do i = 1, n
    re_z(i) = -2.05d0 + 5.0d0 * dble(i-1) / dble(n-1)
    do j = 1, n
      im_z(j)  = -2.0d0 + 5.0d0 * dble(j-1) / dble(n-1)
      z_temp = cmplx(re_z(i),im_z(j),kind=dp)
      f(i,j) = ((z_temp*z_temp - 1.d0)*(z_temp - 2.d0 - cj)**2 )/(z_temp*z_temp+2.d0+2.d0*cj)
    end do
  end do
  ! Plot function
  call domain_plot(re_z,im_z,f)

  ! Generate second test functon
  do i = 1, n
    re_z(i) = -2.d0 + 4.d0*dble(i-1)/dble(n-1)
    do j = 1, n
      im_z(j) = -2.d0 + 4.d0*dble(j-1)/dble(n-1)
      z_temp = cmplx(re_z(i),im_z(j),kind=dp)
      f(i,j) = (z_temp-1.d0)/((z_temp**2)+z_temp+1.d0)
    end do
  end do
  ! Plot the second test function
  call domain_plot(re_z,im_z,f)

end program test_domain_plot