Silverfrost Forums

Welcome to our forums

Saving smoothed data

24 Aug 2021 8:07 #28198

Suppose you have few (x,y) points. You plotted X-Y graph with %PL, chose Designer Mode Plot Parameters/Line Style /Splines, adjusted smoothing parameter so that the line looks perfectly smooth. Now is it possible somehow to save the smoothed data with your chosen X step? Definitely %PL keeps smoothed data somewhere inside

25 Aug 2021 7:56 #28200

The native %pl provides access to the Microsoft GDI+ library. It does not create data for points on the curve between those supplied by the user.

I don't know if the GDI+ library provides functions for interpolation. If not then a back-handed approach would be to detect the colour change directly from the plotted curve.

25 Aug 2021 8:39 #28201

Paul, May be my smoothing wording confused you. I meant not the antialiasing but the spline smoothing with the tension parameter used in the %PL. I meant returning of plotted data back to the user as usual set of x,y points. This data definitely differs from initial one

The user may supply initially just 3-4 (x,y) points. When the %PL smoothing it with its splines the plot has many points in between. Getting back the entire plotted graph as usual (x,y) set is clearly missing feature (if i don't miss something and such functionality already exist)

Currently i digitize the resulting smoothed plot but definitely it is better if %PL was able just to save the plotted data. This is my suggestion for new feature if it's indeed missing.

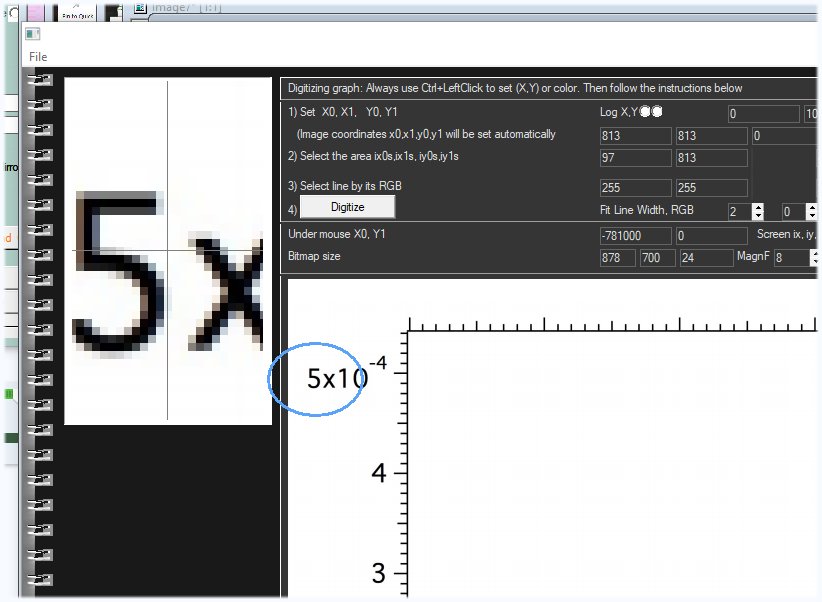
/* By the way my Digitizer program is 100% written in FTN95. It reads drag-and-dropped BMP image, finds the color of plotted curves you select and scaling curves back into numbers. All the work done using just the mouse clicks, you just set four X and Y axis numbers with the keyboard for it to convert pixel coordinates into actual values. I can upload this program to everybody but it has now one small problem: before it was reading any graphics formats FTN95 allows, like PCX, JPG, TIF, GIF etc but i made the bug somewhere long ago and now lazy to fix it. You see below how magnifier works for exact positioning on right places. Digitizing programs are a must for everyone, they are extremely useful. FTN95 allows to create them the way they fit you.

https://i.postimg.cc/pXBMFqNN/Image17.jpg

26 Aug 2021 6:23 #28202

Dan

I understood your question correctly and my reply is the same. %pl passes your data points on to the GDI+ library. It does not interpolate and add new data points. It is the GDI+ library that does the plotting based on your data points and your selection of the spline tension.

There might be a GDI+ function that provides interpolated values from your data points and spline tension for a given value of x (say, assuming your curve is one to one), but I don't think that ClearWin+ can help you here.

26 Aug 2021 5:40 (Edited: 27 Aug 2021 1:19) #28205

I'm surprised that some thirdparty library is used for the plottiing. As a result no one now can do elementary thing like printing the plotted data back to the user. Is this at least Microsoft's own child? Otherwise I'd think native PL in the long run will be screwed if not doomed because all graphics libraries have life span just few years unless they are used by the major players like MS, Linux, Android, Apple and gamers

How to contact developers of this GDI+ software and ask them if they plan to implement saving graphics data to ASCII ?

26 Aug 2021 11:41 #28206

Dan, GDI+ is a Microsoft Windows component, please see https://docs.microsoft.com/en-us/windows/win32/gdiplus/-gdiplus-drawing-cardinal-splines-use for an explanation of splines under tension as implemented in GDI+.

I have never used GDI+ directly, but the linked page suggests to me that the interpolated points are generated just prior to displaying the curve on the output device (monitor screen, etc.), so their count and x-y values are not fixed and not made available to the user.

If you wish to generate your own interpolated points, look into Akima, Lowess and other such schemes. To get a feel for what Akima interpolation does, see https://www.source-code.biz/snippets/typescript/akima/ . Akima interpolation is available in Fortran. See Netlib TOMS #697. Akima interpolation is implemented in R, see https://cran.r-project.org/web/packages/akima/index.html .

27 Aug 2021 2:35 (Edited: 27 Aug 2021 7:02) #28208

Thanks Mecej4. I'd still try to contact Microsoft first about output to ASCII since it would be so nice to have this functionality in the %PL. If they say NO, then would be good if Paul implemented this algorithm in %PL so that we would be able to print the plotted data. This printing to file plotted data functionality is a must in %PL anyway.

Meantime may be someone will make a small demo? I'm too busy right now to experiment. I like approach Mecej4 suggesting because it is always better to not depend on thirdparty. For example with thirdparty GDI+ you can not make such plots like below which look good for advertisements but with mecej4's approach it is 5 minutes job https://i.postimg.cc/L5j0Ywk1/Image15.jpg

27 Aug 2021 6:53 #28211

The GDI+ drawing functions are listed here...

https://docs.microsoft.com/en-us/windows/win32/gdiplus/-gdiplus-graphics-flat

27 Aug 2021 3:56 #28213

Dan, I cannot make sense of your attached image. It seems to be a picture of part of the screen of a cell phone or tablet computer. You wrote, 'plots like below', but the only plots that I can see are postage stamp sized plots of stock prices, which we do not expect to be smooth curves at all.

27 Aug 2021 4:13 #28214

You are right ,Mecej4, i often 5 min later myself do not understand what i wrote. I meant that if you have your own not third party software, you can easier add any tricks to it by any wildest demand - like, for example, these gradient backgrounds under the plots

Please login to reply.