Silverfrost Forums

Welcome to our forums

some problems with 2 %pl options

11 Apr 2021 12:46 #27479

Hello,

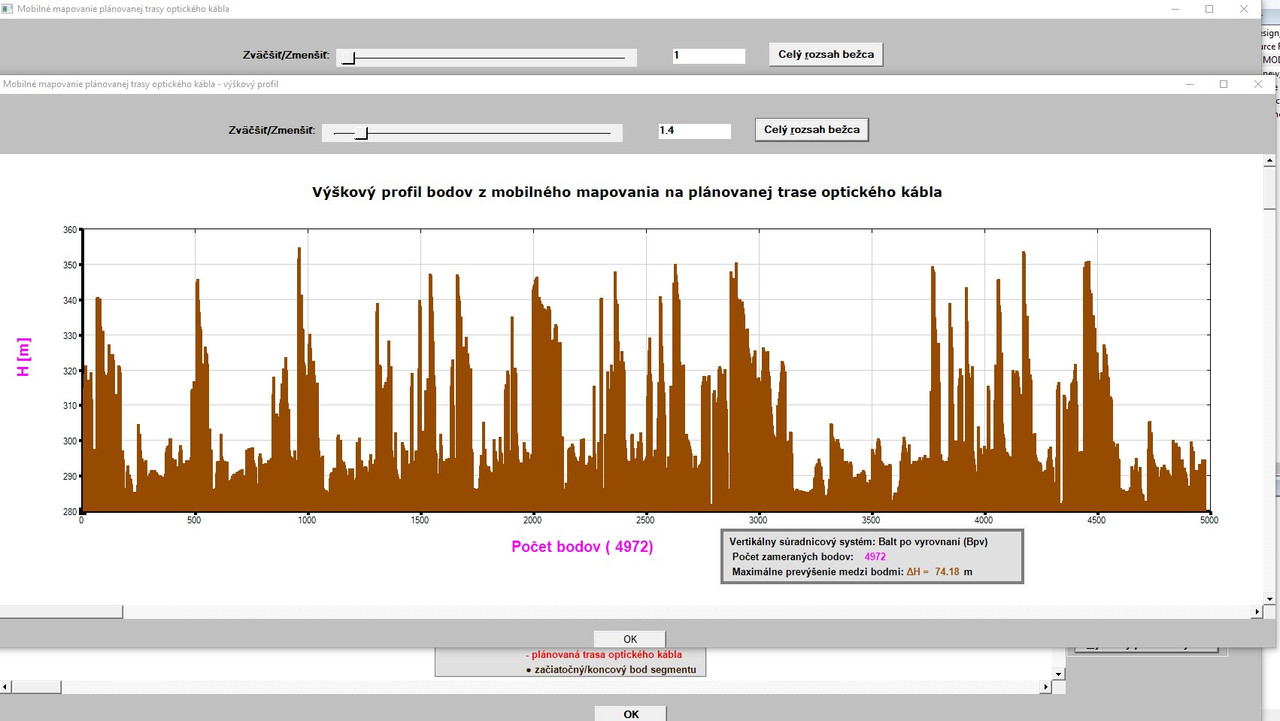
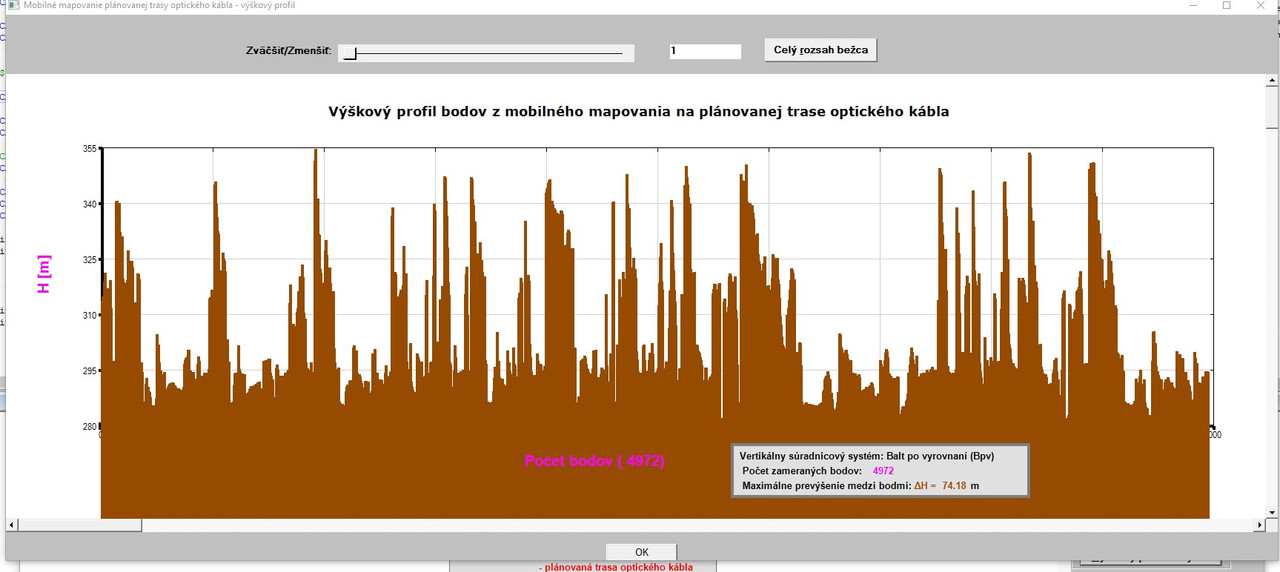
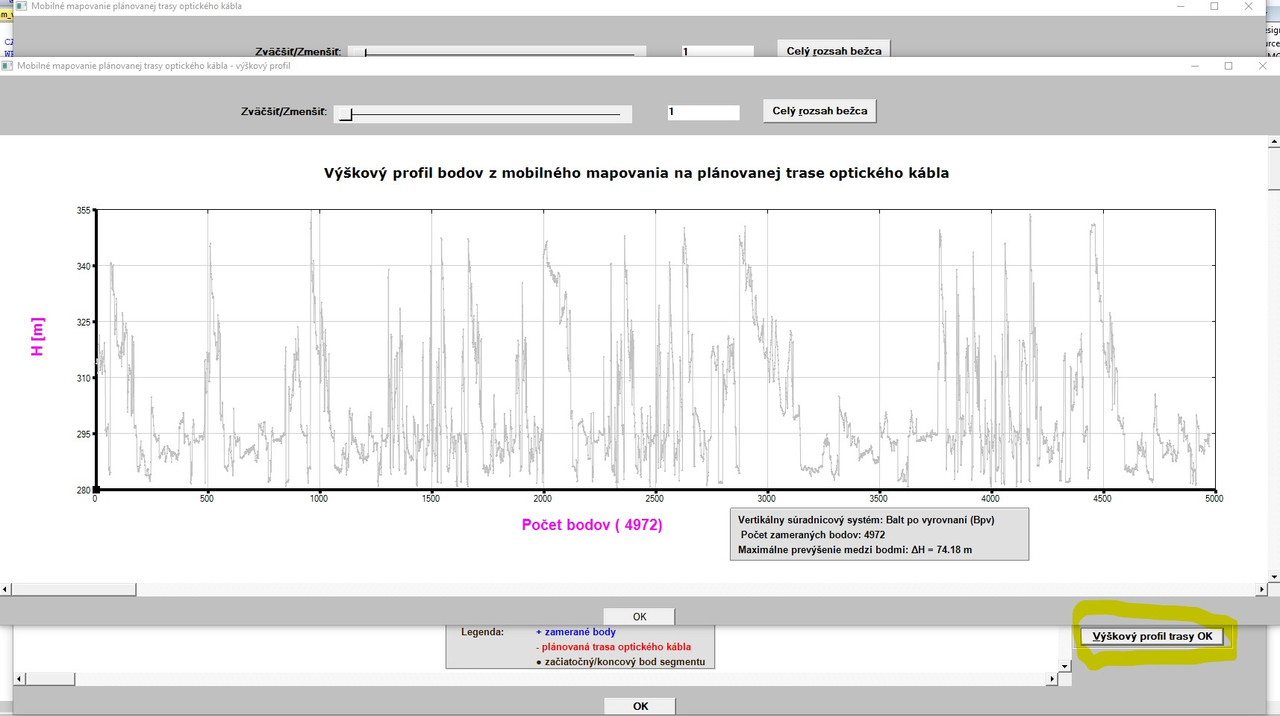
I added a new functionality to my plot to create height profile of the terrain from the surveyed points as follows:

https://i.postimg.cc/yYtJQndz/Vyskovy-profil.jpg

Here, I encountered 2 problems:

1 - I wanted to hatch the area between bottom horizontal axis and the lines which join the height points. I wanted to use for it the %PL option LINK=COLUMNS (at least, I wanted to try it, how the graph will look).

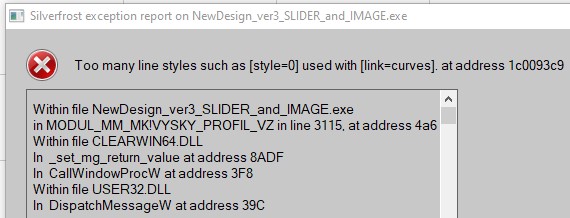
 Although compiling and linking was problem free, when invoking the 
 button for creating height profile, I get the following run-time error:

https://i.postimg.cc/fbLRM9kv/link-columns-chyba.jpg

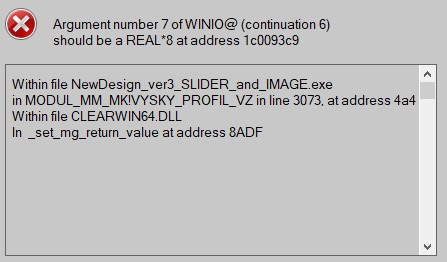
the code in line 3073 where the error message points looks as follows:

iw=winio@('%`^pl&',gw+300,gh-200,L,REAL_L,H_MM,vyskovy_profil_VZ, pl_cb_vz)

So, it points to the argument No. 7, which is a name of a callback (at least I understand the message so). I do not understand, where is the problem (if I remove the option LINK=COLUMNS, everything runs OK).

2 - I wanted to use for the plot above the brown color. So I used (among others) also the %PL option COLOR=BROWN. Again, although compiling and linking was fine, when invoking the CREATE HEIGHT PROFILE button, I get the following message:

https://i.postimg.cc/SxwY1dgM/brown.jpg

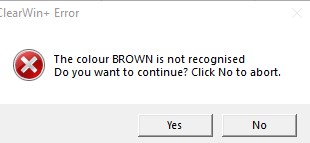
When I click on YES, the plot is empty (only axes and their frames are drawn.

So, my question is - with the %PL option color, only BLUE,RED,YELLOW,GREEN,GREY and BLACK colors can be used (or what color could be used except the named above)? Is there no possibility to use with the %PL option COLOR also RGB@(x,y,z)?

REMARK: When I click on the full extents of slider it never returns fully from its current position to its initial position, although otherwise everything works fine. (I have to move the slider manually to its beginning)

Thanks for comments!

11 Apr 2021 2:18 #27480
program brown_example
use clrwin
implicit none
integer, parameter :: dp =kind(1.d0)
integer, parameter :: n  = 10
real(kind=dp) :: x(1:n) = (/ (i,i=1,n) /), y(1:n) = (/ (i*i,i=1,n) /)
integer iw
iw = winio@('%mn[Exit]&','exit')
call winop@('%pl[native,gridlines,frame,x_array]')
call winop@('%pl[link=lines,symbol=6,colour=#964B00]')   !## The hexadecimal RGB code of Brown is #964B00.
iw = winio@('%pl&',800,400,n,x,y)
iw = winio@(' ')
end
11 Apr 2021 2:58 #27481

Thanks Ken - done!

It works fine (I was unable to find in the docs that also hexadecimal numbers can be used with the %pl COLOUR option).

Now, remains the problem with LINK=COLUMNS.

11 Apr 2021 3:26 #27483

Martin,

Check the value of n_graphs in the earlier call to winop@.

The error message suggests that the call to %pl is not consistent with the earlier winop specification.

Link = columns works in a simple example.

program brown_example2
use clrwin
implicit none
integer, parameter :: dp =kind(1.d0)
integer, parameter :: n  = 150
real(kind=dp) :: x(1:n) = (/ (i,i=1,n) /), y(1:n) = (/ (i*i,i=1,n) /)
integer iw
integer, parameter :: pl_id = 1000
integer, external :: pl_cb
iw = winio@('%mn[Exit]&','exit')
call winop@('%pl[native,gridlines,frame,x_array,n_graphs=1]')
call winop@('%pl[width=4,link=columns,symbol=6,colour=#964B00]')   !## The hexadecimal RGB code of Brown is #964B00.
iw = winio@('%`^pl&',800,400,n,x,y,pl_id,pl_cb)
iw = winio@(' ')
end

integer function pl_cb()
pl_cb = 1
end function pl_cb
11 Apr 2021 6:34 #27485

Ken,

After checking the input data, I discovered something which might have something to do with my problem (with LINK=COLUMNS) and at the moment it is for me mystery.

Originally (when everything is OK and the plotting is fine - I mean the plot with JPG image and the vector data in it as could be seen many times in my previous posts in other topics) I use for the plotting the code:

iw=winio@('%`^pl[full_mouse_input]&',gw,gh,N_PL,Y_OK_U,X_OK_U,handle_pl_ok,pl_cb)

where number of graphs/points represents the N_PL array which contains the values displayed here:

https://i.postimg.cc/MKQZfbmP/N-PL-vs-CPB.jpg

So, in this particular case, the N_PL is an array (sum of points) of 62 graphs (total number of points = 6744 which are used for joining with lines) PLUS the 63rd graph with 4972 points (no joining - surveyed points), hence total number of points is 11716. I think that this was done (with the N_PL arrays) because of STACKED option I used.

Then, based on your advise and to hunt after the run time error when using LINK=COLUMNS for the second and independent plot, I changed the N_PL for the 1st plot to the scalar value of CBP which holds the total number of points 11716:

iw=winio@('%`^pl[full_mouse_input]&',gw,gh,CBP,Y_OK_U,X_OK_U,handle_pl_ok,pl_cb)

In this case, I get the error displayed above telling that in the Graph No. 25, x-value for point number 3 is invalid.

I inspected the input data for this part indicated by error message (in yellow):

https://i.postimg.cc/rm0kvxgR/vstupy.jpg

Formally, there is no invalid data in the input file, otherwise my check in the program would issue a warning and would stop the processing of data (please ignore that the numbering of points does not correspond to the number of lines, the same is with feature coding U21, U22 which should also indicate here the U25 belonging to the Graph 25, since in the Point ID´s and feature coding can be gaps in numbering and it has no influence on processing of the data. I can number the points and use feature codes as I want, there is NO requirement for a continuous numbering/feature coding.

So, what happens here?

Be aware of the fact that the second and independent plot (height profile) draws ONLY 4972 points (surveyed points only).

12 Apr 2021 10:13 #27495

I thoroughly reviewed the situation with my previous post and it has nothing to do with LINK=COLUMNS problem and is clear for me now.

So, now, I have a new situation. I found that in the 2nd plot (height profile) I forgot to explicitly use the %PL options [native] and [n_graphs=1], since I thought that both are default and there is no need to add them explicitly.

So, I explicitly added both above mentioned options to the 2nd plot and removed the options [independent] which was there added by copying some parts from my 1st %PL function.

Now, when I use LINK=COLUMNS for the 2nd plot, I get different run-time error message:

https://i.postimg.cc/gc7dDjQJ/TOO-MANY-STYLES.jpg

I do not use too many line style and do not use the option LINK=CURVES.

Here is the whole code for my 2nd %PL function:

INTEGER FUNCTION VYSKY_PROFIL_VZ ()
IMPLICIT NONE
IF (.NOT. ALLOCATED (REAL_L)) ALLOCATE (REAL_L(L))
DO i=1,L
     REAL_L(i) = dble(i)
   END DO
write(pl_str,'('%pl[margin=(',I3,',',I3,',',I3,',',I3,')]')') mleft-50, mtop, mright-130, mbottom 
call winop@(pl_str)
iw=winio@('%fn[Verdana]%ts[1.4]%bf%gf%sf&',hTitleFont)
call winop_hdl@('%pl[title_hfont]&',hTitleFont)     
CALL ENABLE_UTF8@(1) 
iw=winio@('%ww[no_border]%ca[Mobilné mapovanie plánovanej trasy optického kábla - výškový profil]%bg[grey]&')
 iw=winio@('%2nl%5ta%bf Zväčšiť/Zmenšiť:%ta%50sl%ta%`bg[white]%`rf%sf&',zoom_vz,zoom_min_vz,zoom_max_vz,zoom_vz)
 iw=winio@('%ta%bf%^bt[Celý &rozsah bežca]%sf%2nl&',full_extents_cb_vz)
CALL winop@('%pl[native]') 
CALL winop@('%pl[gridlines]')
CALL winop@('%pl[x_sigfigs=8]')
CALL winop@('%pl[y_sigfigs=6]')
! CALL winop@('%pl[link=columns]')
CALL winop@('%pl[color=#964B00,link=lines,symbol=6,symbol_size=1]')
CALL winop@('%pl[title='Výškový profil bodov z mobilného mapovania na plánovanej trase optického kábla']') 
CALL winop@('%pl[x-axis=@,y-axis=@]') 
CALL winop@('%pl[x_array]') 
CALL winop@('%pl[frame,etched]')
CALL winop@('%pl[axes_pen=4,smoothing=4,frame_pen=1]')
CALL winop@('%pl[n_graphs=1]')
iw=winio@('%vx&',vpage_step_vz,vmax_value_vz, vcur_val_vz)
iw=winio@('%hx&',hpage_step_vz,hmax_value_vz, hcur_val_vz)
iw=SELECT_GRAPHICS_OBJECT@(vyskovy_profil_VZ)       
iw=winio@('%`^pl&',gw+300,gh-200,L,REAL_L,H_MM,vyskovy_profil_VZ, pl_cb_vz)
iw=winio@('%dl&',0.5d0,timer_cb_vz)
iw=winio@('%ff%nl%cn%tt[OK]&')
iw=winio@('%ff%2nl&')						
iw=winio@(' ')

 VYSKY_PROFIL_VZ = 1

END FUNCTION VYSKY_PROFIL_VZ

Is it important the sequence of the %PL options? What´s wrong with the code above, when I get the run-time error demonstrated above?

Thanks for some comments in advance!

12 Apr 2021 9:03 #27512

I finally catch the problem with the %PL [link=columns]:

https://i.postimg.cc/R0HYCWDN/hnedy-profil.jpg

Here are my findings:

  1. If you look in my code above, I have there (among others) the options

    CALL winop@('%PL [link=columns]')
     CALL winop@('%pl[color=#964B00,link=lines,symbol=6,symbol_size=1]')
    

From my today´s experience I definitely can state the following: The simultaneous presence of both options [link=columns] and [link=lines] in the same function does NOT work at all, although compiling and linking is problem free. Therefore I got the run-time error message declared in my previous post.

  1. When I removed the option [link=lines], the run-time error was eliminated, however - it was not enough, since the plot was EMPTY, no points were drawn at all (only axes, frame and gridlines. Look at my code above containing this line:

    CALL winop@('%pl[color=#964B00,link=lines,symbol=6,symbol_size=1]')

This code probably caused that the plot was empty. I found it by accident when I experimented with the sequence of %PL options to find the reason, why the plot is empty.

So, by guessing!!!, I changed the code in the above mentioned line as follows:

CALL winop@('%pl[width=4,link=columns,symbol=6,color=#964B00]')

After this change, NEARLY everything works as presented in the picture above.

I am still hunting the following: When I removed the option LINK=LINES and changed the line above as described, after invoking the button to draw height profile, I always get the following for the first time when plot is drawn:

https://i.postimg.cc/L8Ndsm1j/hnedy-profil-uvod.jpg

As can be seen here, INITIALLY the graph is shifted below horizontal axis. At present, I do not know why. When I move (even slightly) with the vertical scrollbar, then plot is adjusted (and is in right position above horizontal axis) as can be seen in the first picture in this post.

Here the question remains - why?

So, I would be thankful to anybody, if the above described behaviour can be confirmed generally or not. If yes, then

  • it should be clearly stated in the docs that the options LINK=LINES and LINK=COLUMNS are in conflict and cannot be used at the same time
  • and, when using option LINK=COLUMNS, there is a requirement for a specific sequence for additional options.

Thanks to anybody for trying to replicate my situation to see whether it is a specific one or can be generally confirmed/excluded!

Martin

15 Apr 2021 9:50 #27532

The code below replicates the reported problem and also demonstrates a simple fix.

module demo
use clrwin
implicit none 
integer, parameter :: dp = kind(1.d0), npoints=5
real(kind=dp) x(1:npoints), y(1:npoints)

contains
integer function gen_data()
integer i, j
j = -5
  do i = 1, npoints
    x(i) = j  ; y(i) = 1.d0/(j+10)
    j = j+1
  end do
  gen_data = 2
end function gen_data

integer function plot1()
integer iw
  call winop@('%pl[native,x_array,colour=blue,frame,gridlines,link=columns,width=8]')
  iw = winio@('%pl&',800,800,npoints,x,y)
  iw = winio@('%ff%cn%bt[OK]')
  plot1 = 2
end function plot1

integer function plot2()
integer iw
character(len=250) plstr
  call winop@('%pl[native,x_array,colour=blue,frame,gridlines,link=columns,width=8]')
  write(plstr,'('%pl[y_min=',F6.4,']')' ) minval(y)
!  print*, plstr
  call winop@(plstr)
  iw = winio@('%pl&',800,800,npoints,x,y)
  iw = winio@('%ff%cn%bt[OK]')
  plot2 = 2
end function plot2
end module demo

program main
use demo
i = gen_data()
i = plot1()
i = plot2()
end program main
15 Apr 2021 11:25 #27533

Many thanks Ken, great simple fix! Done and it works fine!

Nevertheless, I would also like to formally hear the answers (if possible) whether:

1 - the %PL options LINK=LINES and LINK=COLUMNS are in conflict when they are used simultaneously (so, their simultaneous use is not allowed) 2 - when using the option LINK=COLUMNS, after its use is there a need for specific sequence of additional %PL options which must be maintained and may not be altered.

I think such info would be very useful for everybody.

One more question:

I would also need to have in axis titles/captions (sometimes) also a subscript/superscript (%sd,%su) in the text. I tried to use %sd with DRAW_CHARACTERS@, where previously I tried to write it in an output string, but unsuccessfully. Whereas in standard winio@ operations it works problem free, I would like to see a simple example (if possible) how to achieve it for using with draw_characters@.

Thanks in advance!

16 Apr 2021 10:35 #27551

I suspect that it would be impossible to describe every possible combination of parameters/options that users may try to program in the documentation. Here are my own observations as a user - I can only guess what is 'under the bonnet' of the Clearwin.dll:

[link=columns] and [link=lines] cannot be used when [n_graphs=1]. It should be obvious that this will create a run time error.

When using [link=columns] a width value must be specified [width=2] say, columns (or bars) are not displayed if this width value is not specified.

When using [link=columns] it is not possible to also draw a symbol at the data point (effectively symbol=0). (Unlikely to be a requirement in practice.)

For n_graphs > 1, mixing [link=columns] and [link=lines] is possible.

Remembering that the link/symbol/colour instructions are processed sequentially i.e. first link instruction is applied to graph 1, second to graph 2 and so on. The same applies to colour and symbol.

This can result in some issues with the non-appearance of symbols when mixing multiple graphs with [link=lines] and [link=columns]. This can be avoided by always assigning symbol=0 to the graph which has [link=columns].

The [width] value is mandatory when using [link=columns] and when specified applies to all graphs (including those using [link=lines]).

The observations above can be demonstrated by making modifications to the function plot3 in the following code. As it stands, the code demonstrates that it is possible to combine [link=lines] and [link=columns] for n_graphs=2.

module demo
use clrwin
implicit none 
integer, parameter :: dp = kind(1.d0), npoints=50
real(kind=dp) x(1:npoints), y(1:npoints), z(1:npoints)
contains
integer function gen_data()
integer i, j
j = 1
  do i = 1, npoints
    x(i) = j  ; y(i) = 1.d0/(j+10)
    j = j+1
  end do
  z = 2.5d0*y
  gen_data = 2
end function gen_data
integer function plot3()
integer iw
integer n(1:2)
  n = npoints
  call winop@('%pl[native,n_graphs=2,x_array,frame,gridlines, width=2]')
  call winop@('%pl[link=columns,symbol=0,  colour=red]')        !# Remove symbol=0 here and no symbols are shown!
  call winop@('%pl[link=lines,  symbol=6,  colour=blue]')
  iw = winio@('%pl&',800,800,n,x,y,z)
  iw = winio@('%ff%cn%bt[OK]')
  plot3 = 2
end function plot3
end module demo

program main
use demo
i = gen_data()
i = plot3()
end program main

For displaying captions with mathematical equations I create an external graphics file containing the equation and simply import the file to the appropriate location.

16 Apr 2021 8:14 #27559

Many thanks for sharing of your your valuable experiences with %PL options Ken!

This will avoid (at least for me) to waste my time when using %PL and its options!

It is a pity that such important info is not included in the documentation.

Martin

17 Apr 2021 6:43 #27564

Martin

It is only a matter of resources. Those who provide this service for you also need time to sleep.

19 Apr 2021 10:59 #27578

Thanks Paul!

Of course, everybody - except God - has his limits.

With every of my post my aim is - except my own learning as a novice -
to point to some possible/potential problems of the product indicated by some procedures I used.

This can be used by the authors of the product to improve their own product and make steady advance and refining.

Any other interpretations of my posts is totally incorrect.

Best wishes!

Martin

Please login to reply.