Silverfrost Forums

Welcome to our forums

Problems with %pl

18 Jul 2019 5:42 (Edited: 19 Jul 2019 1:56) #24030

These problems are well known but are not fixed for a long time probably because were not articulated by users clearly. To demonstrate them i made the program where slider just linearly increases value Y. The most important is the problem, or better say, the bug #1.

module mod1
use clrwin
integer, parameter:: N=30
Real*8 X(N),Y(N), Slider
contains
integer function cbSlider()
do i=1,N
  X(i) = i
  Y(i) = Slider*X(i)**3 * exp(-X(i)/3)
enddo
call simpleplot_redraw@
cbSlider=2
end function
end module
!.........................................................
winapp
use mod1

i=winio@('%ww%fn[Tahoma]%ts%bf&', 1.8d0)

i=winio@('%pv%pl[x_axis='Angle',y_axis='Intensity',native,framed,axes_pen=2,frame_pen=2,width=2,&
&n_graphs=1, x_array,scale=log_linear, Y_min=1.e-1]%ff&',740,540,N,X,Y)

i=winio@('%cn%50^sl&', Slider, 1d0, 20d0, cbSlider)

i=winio@('%lw%es',ilw)

i=cbSlider()

end
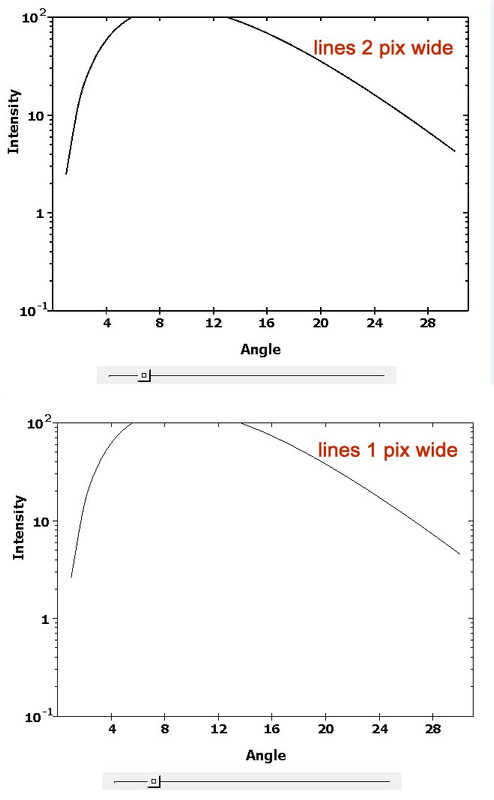
  1. The displayed automatic Y axis maximum does not match the peak Y data value correctly

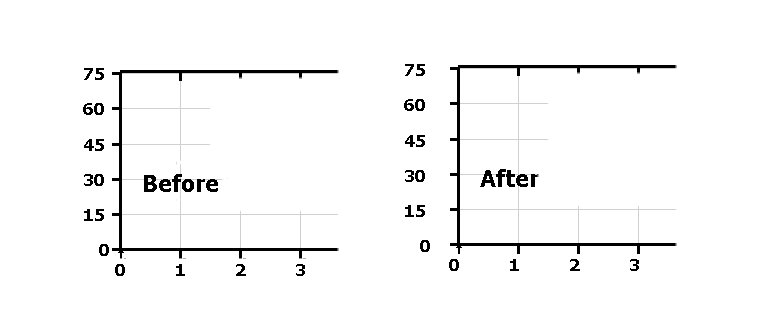
  2. Y axis title centering mechanism is malfunctioning

  3. Left Y axis minor ticks mark length is too small. Major tick mark length is adjustable by user but minor one is fixed. Here is better just to increase minor mark default length 50-70% which will fit most of users or even better also introduce the option for adjusting their length which will fit all 100% users

3a) Bottom X axis tic marks better do one sided (in this example better to be outside the box). Even better solution to fit all users would be to have the options of placing them In, Out or Both sides.

  1. Left Y axis numbers are too close to axis tick marks. If increase major ticks length the position of numbers does not change and they can hit each other. Minor increase of distance would solve the problem for most of users.

  2. In case of LOG scale it is better to use homogeneous 'scientific' numbering like this 10-3, 10-2, 10-1, 100, 101, 102, 10^3. If Y does not go off humanly acceptable range 1/1000 to 1000 it is also possible to use 'engineering' format 0.001, 0.01, 0.1, 1, 10, 100, 1000. Mixing them together possible but not particularly nice looking. Better though to introduce these engineering and scientific numbering options to chose from.

  3. It is better to set the default values for all lines width to at least 2 (i even use 3 here, my monitor is 4K: axes_pen=3, frame_pen=3, width=3), not the current 1 pixel default. If there would be a need for 1 pixel widths (i doubt about that because it is aesthetically unacceptable) the masochistic users can change the defaults ๐Ÿ˜ƒ - see comparison below. Bug #1 and mentioned minor defects are also clearly visible https://i.postimg.cc/2yPTdd8P/pix-size.jpg

19 Jul 2019 10:21 #24039

Hi Dan,

Re: 'humanly acceptable range 1/1000 to 1000' - nice one and good way to put it.

In my field, a parameter named 'hydraulic conductivity' (colloquially 'coefficient of permeability') may take values between 10-1 and 10-14 m/s or perhaps even less, which is probably the biggest log range anywhere.

Eddie

19 Jul 2019 10:21 #24040

Hi Dan,

Re: 'humanly acceptable range 1/1000 to 1000' - nice one and good way to put it.

In my field, a parameter named 'hydraulic conductivity' (colloquially 'coefficient of permeability') may take values between 10-1 and 10-14 m/s or perhaps even less, which is probably the biggest log range anywhere.

Eddie

19 Jul 2019 12:16 #24041

Biggest range anywhere? Not so, if you consider electrical resistivity (in ฮฉยทm):

 Superconductors:  Zero
 Metals               :  1E−8
 Insulators          :  1E+16
19 Jul 2019 12:45 #24042

When is a conductor not a conductor? When it's an insulator. Not the same thing.

21 Jul 2019 4:47 #24050

Agree. Little bit not centered tics and numbers are sometimes visible on X axis with one and three digit numbers. On my example above they are i think OK. It may depend on the font used. Specifically with Y axis. So i did not include that till the better times when all will be more clear.

No number at the beginning could be not a bug and is actually dictated by the data (my X numbers in the example above start with 1). I see other plots now open on my screen, and they all have proper numbers at the beginning of X axis started with zero.

I think i included most of your other suggestions posted before over last year in the list above

23 Jul 2019 3:23 #24067

Quoted from John-Silver BUT .... the scales themselves go from 0 to 31 !!! So, 0 should be marked at left end of scale.

Looks like you are right. I added change to start X from zero

  X(i) = i-1 

and added link=lines but X axis still did not start numbering with zero.

I understand this was design feature not a bug. To kill all birds with one stone. Because there exist situations when X and Y axis go in the middle of plotting surface and there will be no place for zero.

Agree that giving the user option to do numbering of end points would be reasonable design wish. At least no one would blame designers for that ๐Ÿ˜ƒ

Would be nice if designers asked users for priorities what's most important to add or to fix, and what will go for an icing on the cake.

26 Jul 2019 6:58 #24094

Here at Silverfrost we have an ancient typing machine, salvaged from Bletchley Park. When you type in a bug it transfers the input to a 'todo' list. If the input is not a bug, sometimes it transfers the input to a 'wish' list, other times it just discards the input.

It saves me a lot of time and effort.

26 Jul 2019 10:28 #24095

As a Bletchley Park enthusiast, I'd like to know does the machine have a keyboard (thus requiring repunching, which we all know is error-prone) or does it accept Hollerith cards or punched tape?

Apropos the latter two solutions and your admission re discarding, wouldn't it be more politic perhaps to have blamed a 'hanging chad' ? Or a punch card jam? After all the punch machines alone would be getting on for 80 years old.

Eddie

24 Oct 2019 12:42 #24562

More problems. After adding caption to %pl i found that axis numbers all got shifted to the left. Trying to corner this i found that possible reason is in simpleplot_update@ and made this demonstrator. Meantime also found other problems easily visible in this demo. This damn simpleplot_update@ is a source of subtle worms for entire 20 years i use it. Hope it will be finally fixed. To see the bug click on Redraw several times. Also this demo can demonstrate that moving gridline after i=winio@('%pl...') will cause problem with gridlines too.

   module mod1
   use clrwin
   parameter (N=5)
   real*8 X(N), Y(N)
   Data X/1e1, 1e2, 1e3,  1e4, 4e5/
   Data Y/2.2, 66, 8333, 1111, 777/
   save 
   contains

   INTEGER FUNCTION redraw ()  
    CALL simpleplot_redraw@() 
    redraw = 2 
    end function redraw
   end module
!................................
   Program bug333
   use mod1

   i=winio@('%fn[Tahoma]%bf%ts&',2.3d0)
   CALL winop@('%pl[gridlines]') 
   call winop@('%pl[axes_pen=3,frame_pen=3,width=3,x_axis='X Axis Title',y_axis='Y Axis Title']') 
   i=winio@('%ww%pv%pl[native,framed,x_array,scale=log_log,N_GRAPHS=1]%ff&', 925,700, n, X, Y) 
   i=winio@('%sf%cn%^bt[Redraw]&', Redraw)
   i=winio@('%es') 
   end
24 Oct 2019 11:50 #24563

Ouch Dan, that is a major problem with x axis data. After redraw, the value that was previously stored in X is returned as log10(X).

   module mod1 
   use clrwin 
   parameter (N=5) 
   real*8 X(N), Y(N) 
   Data X/1e1, 1e2, 1e3,  1e4, 4e5/ 
   Data Y/2.2, 66, 8333, 1111, 777/ 
   save 
   contains 

   INTEGER FUNCTION redraw ()  
   integer i
    write(6,*)
    write(6,*) 'before redraw'
    write(6,*) '============='
    do i = 1, N
    write(6,*) i, x(i), log10(x(i))
    end do
    CALL simpleplot_redraw@()
    
!    do i = 1, N                ! Uncomment these three lines to 'fix' the x data issue                
!      x(i) = 10.d0**x(i)       ! F77 style
!    end do

!    x = 10.d0**x               ! Or uncomment this single line, F90 style

    write(6,*) 'after redraw'
    write(6,*) '============'
    do i = 1, N
    write(6,*) i, x(i), log10(x(i))
    end do
    redraw = 2 
    end function redraw 
   end module 
!................................ 
   Program bug333 
   use mod1 

   i=winio@('%fn[Tahoma]%bf%ts&',2.3d0) 
   CALL winop@('%pl[gridlines]') 
   call winop@('%pl[axes_pen=3,frame_pen=3,width=3,x_axis='X Axis Title',y_axis='Y Axis Title']') 
   i=winio@('%ww%pv%pl[native,framed,x_array,scale=log_log,N_GRAPHS=1]%ff&', 925,700, n, X, Y) 
   i=winio@('%sf%cn%^bt[Redraw]&', Redraw) 
   i=winio@('%es') 
   end
25 Oct 2019 4:59 #24565

Looks like you are right, Ken. Interesting that Y values are not changed...May be it is good to preserve X values just because SAVE was used above but i have no opinion at this point. Sometimes subroutines return completely destroyed initial data (like Gaussian solvers for example).

Good that this demo exposed additional problems but actually i was hunting different problem this demo does not exactly exposes: after few clicks on redraw the left Y axis numbering gets shifted to the left. This demo shows that but it could be caused by the different problem (like with this LOG scale of X values)

My initial problem i was tried to made reproducer for actually used linear scale! In this case there is no such devastating disaster like in the demo above. And the use of simpleplot_update@ i also used for different reason: to clear the surface for the new plot. May be i used it incorrectly. Is there specific function which can clear the plot ? Then at least one simple problem could be solved (we have few more though we will discuss later in the next messages). In short:

  1. CLEAR_WINDOW@(ihandleOfWindow) where handle is from %hw does not work
  2. CLEAR_WINDOW@(ihandleOfPL) where handle is from %`pl does not work
  3. CLEAR_SCREEN@ works but wipes out everything including axis etc leaving only the plotted curve and the legend. The only which works is simpleplot_update@ but it moves axis numbering way to the left side if you use it
27 Oct 2019 7:17 #24569

Best QA is a lot of users, the more the better. Are you guys using native PL ? If not yet i will be very angry at your stupidity which caused me a lot of lost time. Despite some minor problems it is already has great plotting capabilities. Soon you will see another top journal publication ('Nature') made with both MATLAB and Clearwin

Yes, most probably native PL modified internally X and Y values for log plot but by some reason did not recover the original Xs. Would be better if %pl was keeping the original X values intact.

Also does native PL provide the way to find the values of Xmin and Xmax it uses on the plot (and same for Y) ? This is important because it does not matter what start and end values of user's X are, the plot will use other, 'good looking' numbers for the start and end. After that to place, say, a bullet on the axis user will not know its exact pixel (ix,iy) position on the screen because these values are taken only from 'call get_plot_point@(Xmin, Ymin, ix, iy)', or i miss something ? I made a color bar near right Y axis but due to that effect this bar is permanently jumping little bit together with the plotted data overwriting sometimes the axis itself ๐Ÿ˜ƒ

28 Oct 2019 10:37 #24579

Please see item 415 in cwplus.enh...

415] A new routine PLOT_REDRAW@ has been added to the ClearWin+ library. This looks and works like SIMPLEPLOT_REDRAW@ but the new routine must be used in place of SIMPLEPLOT_REDRAW@ when using logarithmic scales with the native %PL and where the plot data has changed.

Also search for PLOT_REDRAW@ on this forum.

29 Oct 2019 7:23 #24588

Thanks, the plot_redraw@ makes the program do not crash. Also it makes the clear %pl screen (for new update of the plot) even with linear plot, not just LOG like the 415 cwplus.enh tells which is good.

Unfortunately this did not help me to find the problem when i try to dynamically add/remove the legend on the top of the %pl plot for the second time (first appearance of the plot looks OK) causing the Y axis numbers to shift to the left (as well as X numbers a bit shift too).

On the smaller extracted demo all works fine though and i still can not find the bug. Seems my idea of integration everything into the large do-everything user-friendly and nice looking code for easier use of all the resources of the code is wrong. The debugging becomes living hell. I spend all my 24/7/365 time on debugging. All serving subroutines like plotting have to be independent (or very very primitive) despite the data to feed them will be very large. Lego blocks idea with elementary subprograms easily removable seems is the only way.

8 Nov 2019 6:25 #24642

https://i.postimg.cc/tgQq94hW/PL-PLOT-Legend.jpg

8 Nov 2019 3:19 #24643

Something that struck my eye:

In both, the tick for 75 at the upper left corner is not quite aligned with the top frame line. This is in contrast with the other tick marks such as 60, 45, etc., which are nicely centered on the faint grid lines.

There is a small triangle at the origin. Does that have any significance?

8 Nov 2019 6:33 #24645

After i apply draw_characters@ which plots the text string 'Before' or 'After' on top of %pl plot the Y numbers and a bit X one too shift to the left

As to tiny triangle or sometimes square in the zero position of axis X and Y - this is small bug of %pl we pointed out few times before. This definitely has to be fixed by SFrost.

This so annoyed me that I extracted this part but the damn devilry thing disappeared and did not allow me to catch the problem so far. So what I often do is I create the %pl plot with shifted numbering, make a screenshot and photoshop the image moving numbers back as well as edit this tiny triangle or box in the corner. 'Before' part of this plot above is exactly photoshopped part forgetting only to remove the triangle

My suggestion is to ask Paul to allow multiple title legends instead of just one. That will prevent us hacking with draw_characters@ when adding text on top is needed

By the way when I make the plot for the first time or close and reopen it again all looks OK. The shift appears when I add draw_characters@ text on top of already existing plot. I realize that %pl may not like dynamic updates in this case but it's so convenient to place numerous buttons and radiobuttons on the same window as %pl for adjusting the plot without closing it and plotting again. I already do that 1000 times per day

As to 'In both, the tick for 75 at the upper left corner is not quite aligned with the top frame line' - this does not matter actually, it does not have to align. It may look a bit nicer in this specific case if it aligned though

11 Nov 2019 11:55 #24651

Here is what ideal %pl should allow. Google public data plot. All dynamically changeable, plots, axis units, limits. All visually with the click. There are different types of plots, just click around.

Place the entire link into your browser, usual way of showing links does not work. Click on Switzerland or USA and watch magic. Do not worry for safety, this is Google, because if you do not trust Goggle then better do not use internet at all

https://www.google.com/publicdata/explore?ds=d5bncppjof8f9_&met_y=ny_gdp_pcap_cd&idim=country:AZE:GEO:TUR&hl=en&dl=en#!ctype=l&strail=false&bcs=d&nselm=h&met_y=ny_gdp_pcap_pp_kd&scale_y=lin&ind_y=false&rdim=region&idim=country:RUS:GRC:GBR:USA&ifdim=region&hl=en_US&dl=en&ind=false

12 Nov 2019 9:31 #24656

John,

  1. If you can make a small demo reproducing shift of numbering when you dynamically add and remove draw_character@ after you already created the plot -- that would be great

  2. I initially did not understand your need with the additional functions to find exact position or tics etc. Now i see the reasons for that. The %pl for example sets initial or final value for X by its own way ignoring user defined numbers. This is good and right thing to do but we do not know in advance or after plot was done how to find these new X and Y limits values to define the correct scaling for user other needs. The tic marks for example will be impossible to do manually if you do not know initial and find values of X or Y. The position of caption will be impossible to place in exact place of the plot etc

  3. As i described it above the user has little control over exact numbers for start and finish of X and Y axis which sometimes is needed

  4. I do not know if this is already done but in my version of software if you set the step of placing tic marks this has no effect.

But in general with the user adjustments, settings and manipulations i almost always succeed to make professionally looking plots. If SFrost would listen users more actively and communicate with them more often my wish of making pro plots from the first attempt with the minimal programming (ideally in one single line of Fortran source text) would be already realized.

Please login to reply.