 |
forums.silverfrost.com
Welcome to the Silverfrost forums
|
| View previous topic :: View next topic |
| Author |
Message |
Martin_K
Joined: 09 Apr 2020
Posts: 227
|
 Posted: Tue Mar 30, 2021 11:21 pm Post subject: Posted: Tue Mar 30, 2021 11:21 pm Post subject: |
 |
|
Ken,
I cannot find words, your tips are priceless!!!!
Again - the shot directly to the (practically invisible) target!
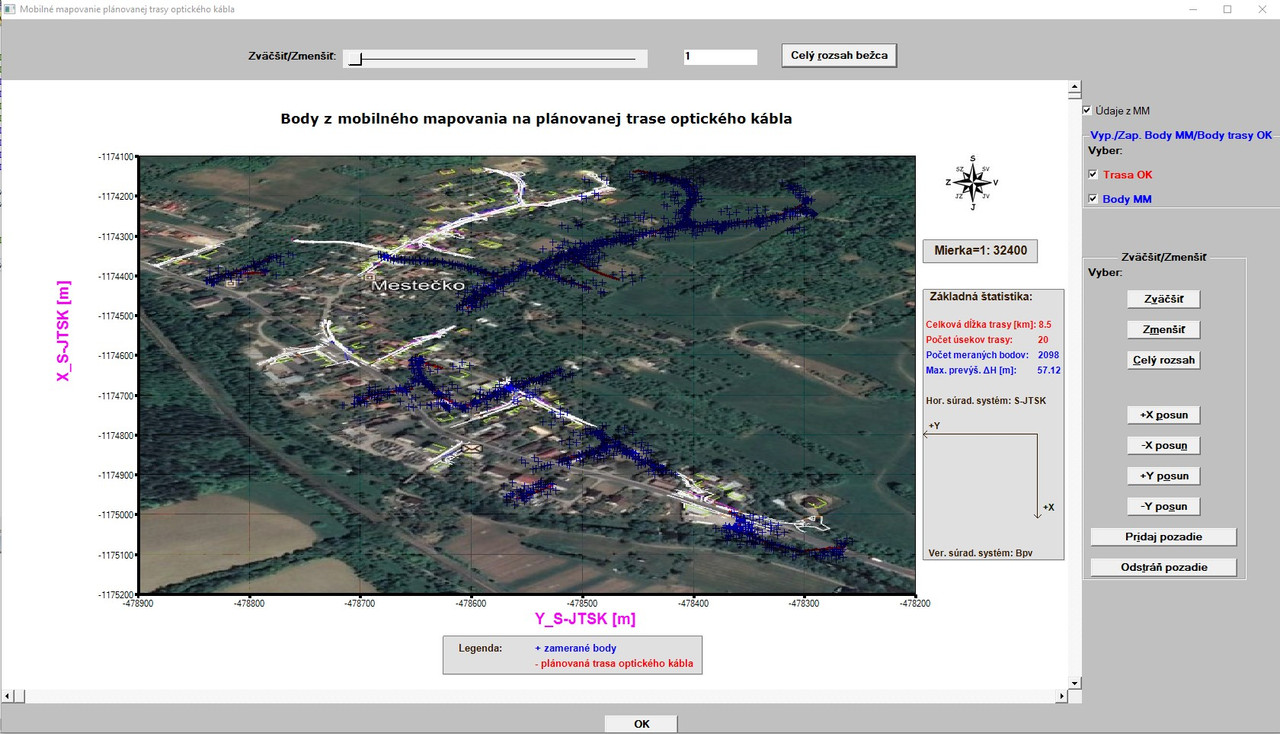
Look at the picture now (the destination has mleft, mtop offsets and source graphic region has ZERO offsets):

Please - do not pay attention to the grey box (Basic Statistics) to the right
of the graph - I can easily adjust it, just I quickly tried your tip.
But this situation (when I removed the h + v scrollbars) evokes necessary question:
Since I want to have there the vertical and horizontal scrollbars which provide very professional look of the graphics, where is the
problem and how can it be eliminated?
P.S. I tested it several times (even with totally another set of data and JPG image) and the behaviour is the same. I suppose
that explanation for it could be that when the h+v scrollbars are added, their thickness is also automatically added to the graphics region (it means - graphics region
is extended in their thickness) and IMPORT_FILE_IMAGE@ properly stretches the imported JPG image to cover whole graphics region.
So, the task is to avoid the adding of the thickness of h+v scrollbars to the graphic region. |
|
| Back to top |
|
 |
Kenneth_Smith
Joined: 18 May 2012
Posts: 697
Location: Hamilton, Lanarkshire, Scotland.
|
| Posted: Thu Apr 01, 2021 11:29 am Post subject: |
|
|
Now reinstate the %vx and %hx in your code. DO NOT reinstate the corresponding [vscroll,hscroll] options for %pl.
This is not aligned with the description in the help file but try it to see what happens. |
|
| Back to top |
|
|
Martin_K
Joined: 09 Apr 2020
Posts: 227
|
| Posted: Thu Apr 01, 2021 12:32 pm Post subject: |
|
|
It seems that the problem is solved now - thanks Ken!
I removed the vscroll, hscroll as %PL options and everything seems to
work properly.
I had to slightly move the two grey boxes further to the right.
What conclusion can be drawn that when using function IMPORT_FILE_IMAGE@ to
the %PL graphic the hscroll, vscroll option may not be used as options with %PL
and the %vx, %hx can only be used separately? |
|
| Back to top |
|
|
PaulLaidler
Site Admin
Joined: 21 Feb 2005
Posts: 7928
Location: Salford, UK
|
| Posted: Thu Apr 01, 2021 1:26 pm Post subject: |
|
|
Ken
If possible, can you provide a short sample of what works and what does not work for %pl scroll bars so that I can correct the documentation. |
|
| Back to top |
|
|
Kenneth_Smith
Joined: 18 May 2012
Posts: 697
Location: Hamilton, Lanarkshire, Scotland.
|
| Posted: Thu Apr 01, 2021 2:08 pm Post subject: |
|
|
Paul,
Here is a sample for %pl. Similar issue for %gr in the following post.
Although I accidentally found how to align everything up correctly, there is a clue in the documentation as %vx and %hx are described as applying to the next control so [vscroll,hscroll] do look to be redundant.
| Code: | winapp
module demo_pl_with_scroll_mod
use clrwin
implicit none
integer, parameter :: dp=kind(1.d0)
integer, parameter :: gw = 400, gh = 400, mtop = 50, mbottom = 50, mleft = 100, mright = 40
integer, parameter :: vpage_step=10, vmax_val=100, hpage_step=10, hmax_val=100
integer :: vcur_val=0, hcur_val=0
integer, parameter :: n = 6
real(kind=dp) :: x(1:n) = (/ (i-1 ,i=1,n) /), y(1:n) = (/ ((i-1)**2, i=1,n) /)
contains
integer function plot_data()
integer iw
character(len=126) pl_str
iw = winio@('%bg&',rgb@(240,240,250))
iw = winio@('%fn[Consolas]&')
iw = winio@('%3.1ob&')
iw = winio@('%tc[red]%cnBAD%tc[black]%nl&')
call winop@('%pl[native,x_array,independent,frame,etched,gridlines,width=4,colour=blue,smoothing=4]')
write(pl_str,'("%pl[margin=(",I3,",",I3,",",I3,",",I3,")]")') mleft, mtop, mright, mbottom
call winop@(pl_str)
call winop@("%pl[Title='Scroll bars with Vscroll/Hscroll']")
iw = winio@("%vx&", vpage_step, vmax_val, vcur_val)
iw = winio@("%hx&", hpage_step, hmax_val, hcur_val)
iw = winio@('%^pl[vscroll,hscroll]&',gw,gh,n,x,y,pl_cb)
iw = winio@('%cb&')
iw = winio@('%tc[green]%cnGOOD%tc[black]%nl&')
call winop@('%pl[native,x_array,independent,frame,etched,gridlines,width=4,colour=blue,smoothing=4]')
call winop@(pl_str)
call winop@("%pl[Title='Scroll bars without Vscroll/Hscroll']")
iw = winio@("%vx&", vpage_step, vmax_val, vcur_val)
iw = winio@("%hx&", hpage_step, hmax_val, hcur_val)
iw = winio@('%^pl&',gw,gh,n,x,y,pl_cb)
iw = winio@('%cb&')
iw = winio@('%tc[green]%cnGOOD%tc[black]%nl&')
call winop@('%pl[native,x_array,independent,frame,etched,gridlines,width=4,colour=blue,smoothing=4]')
call winop@(pl_str)
call winop@("%pl[Title='No scroll bars']")
iw = winio@('%^pl&',gw,gh,n,x,y,pl_cb)
iw = winio@('%cb&')
iw = winio@('%ff%nl%cn%bn[OK]&')
iw = winio@(' ')
plot_data = 1
end function plot_data
integer function pl_cb()
call set_line_width@(2)
call draw_rectangle@(mleft, mtop, gw - mright, gh - mbottom, rgb@(255,0,0))
call set_line_width@(1)
pl_cb = 2
end function pl_cb
end module demo_pl_with_scroll_mod
program main
use demo_pl_with_scroll_mod
i = plot_data()
end program main
|
Last edited by Kenneth_Smith on Thu Apr 01, 2021 2:15 pm; edited 1 time in total |
|
| Back to top |
|
|
Kenneth_Smith
Joined: 18 May 2012
Posts: 697
Location: Hamilton, Lanarkshire, Scotland.
|
| Posted: Thu Apr 01, 2021 2:10 pm Post subject: |
|
|
| Code: | winapp
module demo_gr_with_scroll_mod
use clrwin
implicit none
integer, parameter :: dp=kind(1.d0)
integer, parameter :: gw = 400, gh = 400, mtop = 50, mbottom = 50, mleft = 100, mright = 40
integer, parameter :: vpage_step=10, vmax_val=100, hpage_step=10, hmax_val=100
integer :: vcur_val=0, hcur_val=0
integer, parameter :: uid(3) = (/1001,1002,1003/)
contains
integer function plot_data()
integer iw
character(len=126) pl_str
iw = winio@('%bg&',rgb@(240,240,250))
iw = winio@('%fn[Consolas]&')
iw = winio@('Click on draw button%nl&')
iw = winio@('%3.1ob&')
iw = winio@('%tc[red]%cnBAD%tc[black]%nl&')
iw = winio@("%vx&", vpage_step, vmax_val, vcur_val)
iw = winio@("%hx&", hpage_step, hmax_val, hcur_val)
iw = winio@('%`gr[vscroll,hscroll]&',gw,gh, uid(1) )
iw = winio@('%cb&')
iw = winio@('%tc[green]%cnGOOD%tc[black]%nl&')
iw = winio@("%vx&", vpage_step, vmax_val, vcur_val)
iw = winio@("%hx&", hpage_step, hmax_val, hcur_val)
iw = winio@('%`gr&',gw,gh, uid(2) )
iw = winio@('%cb&')
iw = winio@('%tc[green]%cnGOOD%tc[black]%nl&')
iw = winio@('%`gr&',gw,gh, uid(3) )
iw = winio@('%cb&')
iw = winio@('%^bt[Draw]&',draw_cb)
iw = winio@('%ff%nl%cn%bt[OK]&')
iw = winio@(' ')
plot_data = 1
end function plot_data
integer function draw_cb()
integer i
do i = 1, 3
call select_graphics_object@(uid(i))
call set_line_width@(2)
call draw_rectangle@(mleft, mtop, gw - mright, gh - mbottom, rgb@(255,0,0))
call draw_filled_rectangle@(gw-10,10,gw,0,rgb@(255,0,0))
call draw_filled_rectangle@(gw-10,gh-10,gw,gh,rgb@(255,0,0))
call draw_filled_rectangle@(1,1,10,10,rgb@(255,0,0))
call draw_filled_rectangle@(1,gh,10,gh-10,rgb@(255,0,0))
end do
draw_cb = 2
end function draw_cb
end module demo_gr_with_scroll_mod
program main
use demo_gr_with_scroll_mod
i = plot_data()
end program main
|
|
|
| Back to top |
|
|
PaulLaidler
Site Admin
Joined: 21 Feb 2005
Posts: 7928
Location: Salford, UK
|
| Posted: Thu Apr 01, 2021 2:29 pm Post subject: |
|
|
Ken
The two approaches have different outcomes but I think that it is possible to use either. I will try to amend the documentation accordingly.
When using vscroll/hscroll as %pl options, the scrollbars are included in the control (i.e. the child window). Otherwise the scrollbars are provided as separate controls that are linked to the graphics region within ClearWin+.
It certainly looks like it is better for you if you don't use these options. |
|
| Back to top |
|
|
Kenneth_Smith
Joined: 18 May 2012
Posts: 697
Location: Hamilton, Lanarkshire, Scotland.
|
| Posted: Thu Apr 01, 2021 5:39 pm Post subject: |
|
|
Thanks Paul,
I understand what is happening now.
There is a second difference between the two approaches to catch the unwary.
Without the [vscroll,hscroll] options, when the %pl callback runs clearwin_string@(CALLBACK_REASON) will not return VSCROLL or HSCROLL.
In these cases, appropriate callbacks must be attached to %vx and %hx, or have the updated scroll data processed later for example by a %dl callback. |
|
| Back to top |
|
|
John-Silver

Joined: 30 Jul 2013
Posts: 1520
Location: Aerospace Valley
|
| Posted: Sat Apr 03, 2021 9:53 pm Post subject: |
|
|
Martin_K,
on the 2 plots you posted on 30 march and 1st april, the distribution of points (the blue) are not the same !
Not just in a different position, there are different numbers of points. Is that correct ?
_________________
''Computers (HAL and MARVIN excepted) are incredibly rigid. They question nothing. Especially input data.Human beings are incredibly trusting of computers and don't check input data. Together cocking up even the simplest calculation ...  " " |
|
| Back to top |
|
|
Martin_K
Joined: 09 Apr 2020
Posts: 227
|
| Posted: Sat Apr 03, 2021 10:20 pm Post subject: |
|
|
No John.
The data set is the same, in the second plot I slightly changed the mleft margin value to have more place for the two grey boxes to the right of the plot
although in the scale nothing formally changed since the scale is rounded to the nearest whole hundred. |
|
| Back to top |
|
|
John-Silver
Joined: 30 Jul 2013
Posts: 1520
Location: Aerospace Valley
|
| Posted: Mon Apr 05, 2021 8:50 pm Post subject: |
|
|
Martin_K,
look at the group of points around the word(place name?) 'Mestecko' on the 2 plots.
First, Concentrating on the cross directly under the letter 'O' on the second plot.
On the first plot it was under a point midway between the 'c' and 'k'
Note this distance of movement.
Now look ABOVE the letter 'M' at the beginning of the word - on one plot (the second one) there are no points to the left of the letter, on the other (the first one in your post) there are many which extend approximately twice the distance to the left of the letter than the movement mentioned above !
(This is not the only place !)
I'm confused.
_________________
''Computers (HAL and MARVIN excepted) are incredibly rigid. They question nothing. Especially input data.Human beings are incredibly trusting of computers and don't check input data. Together cocking up even the simplest calculation ... " |
|
| Back to top |
|
|
Martin_K
Joined: 09 Apr 2020
Posts: 227
|
| Posted: Tue Apr 06, 2021 9:54 am Post subject: |
|
|
John,
you are probably right - but it has no meaning for my purpose. Remember - the JPG raster is - in fact - a pure screenshot of a georeferenced JPG raster image
displayed in the mobile mapping processing software using Snip&Sketch tool. And - as I already said, I changed the value for left margin between two images, which has its influence.
So, the JPG screenshot has nothing to do with the real vector graphics, where all points have real geodetical coordinates. It can hardly be aligned
with vector graphics (points with the real geodetical coordinates). The screenshot depends what you select in the Snip&Sketch.
Here - it serves only for general purposes - approximately in which area was the mobile mapping done and to have something in the background in otherwise white background plot.
Therefore I suggested to add an option in the %pl to load in a georeferenced raster JPG image. It would mean that the real geodetical coordinates would be known
for the top left corner of such image, then there is also specified its pixel size, so every pixel(point) in such image would have its real geodetical coordinates. This could be very well aligned with vector graphic.
Nevertheless, thanks for your observant remarks!
Martin |
|
| Back to top |
|
|
John-Silver
Joined: 30 Jul 2013
Posts: 1520
Location: Aerospace Valley
|
| Posted: Tue Apr 06, 2021 12:12 pm Post subject: |
|
|
Martin_K, you're welcome (for my comments)
it is a little perturbing though to hear that the points are only 'approximately' in their actual locaions relaive to the image.
another, maybe clearer example is in the bottom RH corner !
may i suggest that you might include a note on the plot, for new users who may not be aware of this fact regarding the 'approximate' positioning of the blue crosses.
_________________
''Computers (HAL and MARVIN excepted) are incredibly rigid. They question nothing. Especially input data.Human beings are incredibly trusting of computers and don't check input data. Together cocking up even the simplest calculation ... " |
|
| Back to top |
|
|
Martin_K
Joined: 09 Apr 2020
Posts: 227
|
| Posted: Tue Apr 06, 2021 12:22 pm Post subject: |
|
|
This is a good idea John!
I will include this useful remark somewhere below the plot - thanks!
Martin
P.S. To be clear - the vector points are very precise (their horizontal accuracy is on the level of several centimeters)! So they are accurately displayed in the plot. The term APPROXIMATELY refers to the background
JPG image, when it is loaded to the plot into the background
(due to known reasons). |
|
| Back to top |
|
|
John-Silver
Joined: 30 Jul 2013
Posts: 1520
Location: Aerospace Valley
|
| Posted: Tue Apr 06, 2021 12:54 pm Post subject: |
|
|
just an aesthetic/usability comment ...
BLUE is not a very good choice (for my eyes at least) to go over a significantly GREEN background picture
maybe eventually you should introduce a user-selectable option for the colour of the crosses... just for blind users like me !
good luck anyway, you're making consistent strides in your mastery of this devilry.
_________________
''Computers (HAL and MARVIN excepted) are incredibly rigid. They question nothing. Especially input data.Human beings are incredibly trusting of computers and don't check input data. Together cocking up even the simplest calculation ... " |
|
| Back to top |
|
|
|
|
You cannot post new topics in this forum
You cannot reply to topics in this forum
You cannot edit your posts in this forum
You cannot delete your posts in this forum
You cannot vote in polls in this forum
|
Powered by phpBB © 2001, 2005 phpBB Group
|

