 |
forums.silverfrost.com
Welcome to the Silverfrost forums
|
| View previous topic :: View next topic |
| Author |
Message |
John-Silver

Joined: 30 Jul 2013
Posts: 1520
Location: Aerospace Valley
|
 Posted: Sun Mar 21, 2021 9:54 pm Post subject: Posted: Sun Mar 21, 2021 9:54 pm Post subject: |
 |
|
Ken
, is there a specific reason why the 'length' of pl_str is set to 126 ?
_________________
''Computers (HAL and MARVIN excepted) are incredibly rigid. They question nothing. Especially input data.Human beings are incredibly trusting of computers and don't check input data. Together cocking up even the simplest calculation ...  " " |
|
| Back to top |
|
 |
Kenneth_Smith
Joined: 18 May 2012
Posts: 697
Location: Hamilton, Lanarkshire, Scotland.
|
| Posted: Sun Mar 21, 2021 10:29 pm Post subject: |
|
|
John,
Only in the sense that it's sufficiently long to avoid character buffer errors for something like:
'%pl[x_min=-1000.0,x_max=+1000,dx=100,x_sigfigs=2,y_min=-1000.0,y_max=+1000,dy=100,y_sigfigs=2]' |
|
| Back to top |
|
|
Martin_K
Joined: 09 Apr 2020
Posts: 227
|
| Posted: Mon Mar 22, 2021 11:24 am Post subject: |
|
|
Thanks Ken!
I read the section regarding the COPY_GRAPHICS_REGION@ many times in the on-line manual (which also you pasted in your previous post), but due to its vague formulation I did not understand it as a whole, since I did not know what is the real meaning of DX,DY and SX,SY values. Now, thanks to your explanation I know that he values DX,DY,SX,SY represent margins.
Nevertheless, I still have couple of questions. Please have a look at the picture below (outlined a pixel coordinate system):
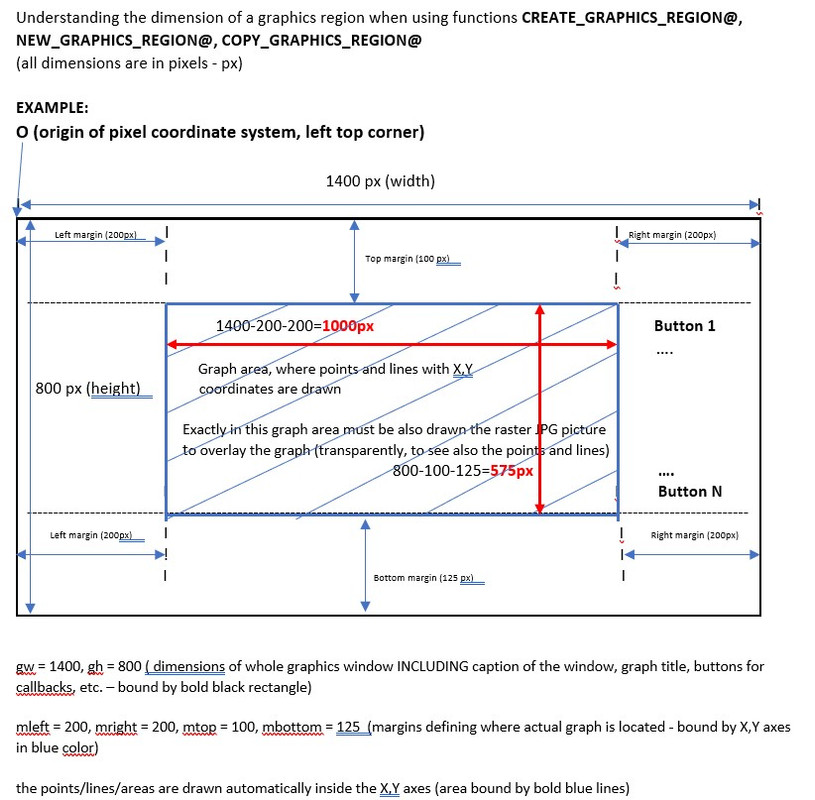
If my understanding (imagination) of a pixel coordinate system pictured above is correct (if not, correct me) the questions are:
A)
I defined the whole window area (DW,DH dimensions: 1400x800) to accommodate all texts, buttons, titles, caption, graphs but with NO margin option for the %PL (I did not use the option margin at all). The graph itself, where points and lines are drawn, was automatically created by %PL and bound by X,Y axes. This graph is smaller than 1400x800 window.
How can I automatically (by program or an option in %PL) detect the pixel coordinates of at least one corner of the graph (say top left) bound by X,Y axes, where the input data (points) are drawn?
The procedure with GUESSING the offsets is not usable.
B)
When I loaded in the raster jpg image, it was placed within whole white area of the graph (overlaying graph title, X,Y captions and legend). This was of coarse not wanted, so I started to try to lower the image dimensions. Unfortunately, I did it manually, tentatively and in few iterations (I started to use the DX, DY values (margins) with 120, 80 it did not fit, then I used 150, 90, it did not fit and finally I guessed!!! the correct DX, DY values (200,200), where the top left corner of the vector graphs coincided with top-left corner of the loaded raster image. But this was all, no other dimension coincided, so I posted my questions in my previous post. Based on your answer, I used the MARGIN option for %PL and the result can be seen below:
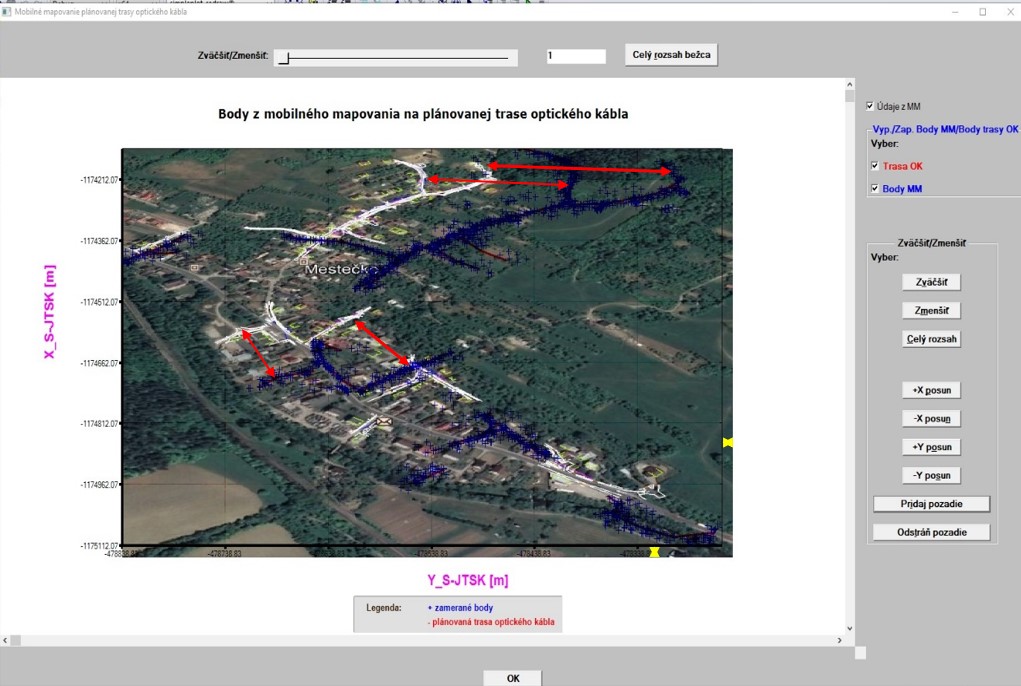
I used the code (for adjusting raster image to vector graph):
| Code: |
i = COPY_GRAPHICS_REGION@(handle_pl_OK, 200, 100, gw-mleft-mright, gh-mtop-mbottom, &
1001, 0, 0, WIDTH_RASTER, HEIGHT_RASTER, 8913094)
|
It nearly fits, although not 100% (see two yellow lines in the picture to the bottom right). I could lower it in both directions by value 10 (it would then fit quite good) but then there remain 2 black strips (horizontally and vertically).
The question is:
Why when using GW-MLEFT-MRIGHT and GH-MTOP-MBOTTOM the image does not coincide exactly to the graph within X,Y bounds?
C)
Moreover, although the image was created by me a few months ago, at that time with no intention to use it for such purposes like now, you can see in the picture above (see red lines with arrows) very big displacement of the data when comparing them to the image background). I can investigate how could I create the IMAGE as a raster with no association to real geodetic coordinates in my mobile mapping processing software (where all is treated exclusively and ONLY in real geodetic coordinates and in real geodetic coordinate system), however I am afraid that this way to overlay the vector data (with real geodetic coordinates) in the graph with an un-georeferenced image (with no coordinate association) is the way to nowhere, impassable and closed.
Nevertheless, it would be great to introduce an internal function like GET_DATA_SCALE@ which would output the graph scale (which scale in the graph is used for the drawn data by %PL. All maps have a scale like: 1:500, 1:1000, 1:10000,
Or to have a possibility to specify a particular scale info to %PL (I do not mea |
|
| Back to top |
|
|
Martin_K
Joined: 09 Apr 2020
Posts: 227
|
| Posted: Mon Mar 22, 2021 12:22 pm Post subject: |
|
|
still last sentence of my previous post:
I do not mean current scale options for %PL like SCALE=LINEAR,
I mean to tell %PL to draw all input data in linear scale let say 1:1000, it means SCALE=1000 or SCALE = 500,
). |
|
| Back to top |
|
|
Kenneth_Smith
Joined: 18 May 2012
Posts: 697
Location: Hamilton, Lanarkshire, Scotland.
|
|
| Back to top |
|
|
Kenneth_Smith
Joined: 18 May 2012
Posts: 697
Location: Hamilton, Lanarkshire, Scotland.
|
| Posted: Mon Mar 22, 2021 10:15 pm Post subject: |
|
|
Re item C)
Surely you know the physical coordinates corresponding to the top left and bottom right corners of your image, and GET_DIB_SIZE@ gives you the dimensions of the image in pixels.
So for the horizontal direction the physical coordinates of the image range from xmin to xmax, and the pixel coordinates of the image range from 1 to width (or pmax) returned by GET_DIB_SIZE@.
For the physical range [xmin,xmax] and the pixel range [1,pmax], then a value x in the range [xmin,xmax] is linearly mapped to a value p in the range [1,pmax] (using real arithmetc) as
p = 1 + (x-xmin)*(pmax-1)/(xmax - xmin)
Same for the vertical direction.
The top left and bottom right pixel coordinates of the %pl frame can be calculated from the %pl graphics width, height, and margins.
The corresponding physical coordinates can be determined from GET_PLOT_DATA@.
Using these physical coodinates and the linear mapping, you can calculate SX, SY, SWIDTH, SHEIGHT for COPY_GRAPHICS_REGION@ for any x and y ranges displayed by %pl, such that the different coordinate systems are correctly aligned.
Unfortunately, I cannot comment on the correction of planar (stretch) distortion in your image.
PS The required mathematics to undistort photographs taken of a flat piece of land photographed from an angle are clearly described here http://paulbourke.net/geometry/transformationprojection/ |
|
| Back to top |
|
|
Martin_K
Joined: 09 Apr 2020
Posts: 227
|
| Posted: Thu Mar 25, 2021 5:03 pm Post subject: |
|
|
Many thanks for your kind help, Ken!
Now, it is clear and understandable what means a pixel coordinate system and how it is associated with real geodetic coordinates in the graph.
It is pity that such essential information is not available in the on-line help (at least I did not find it there).
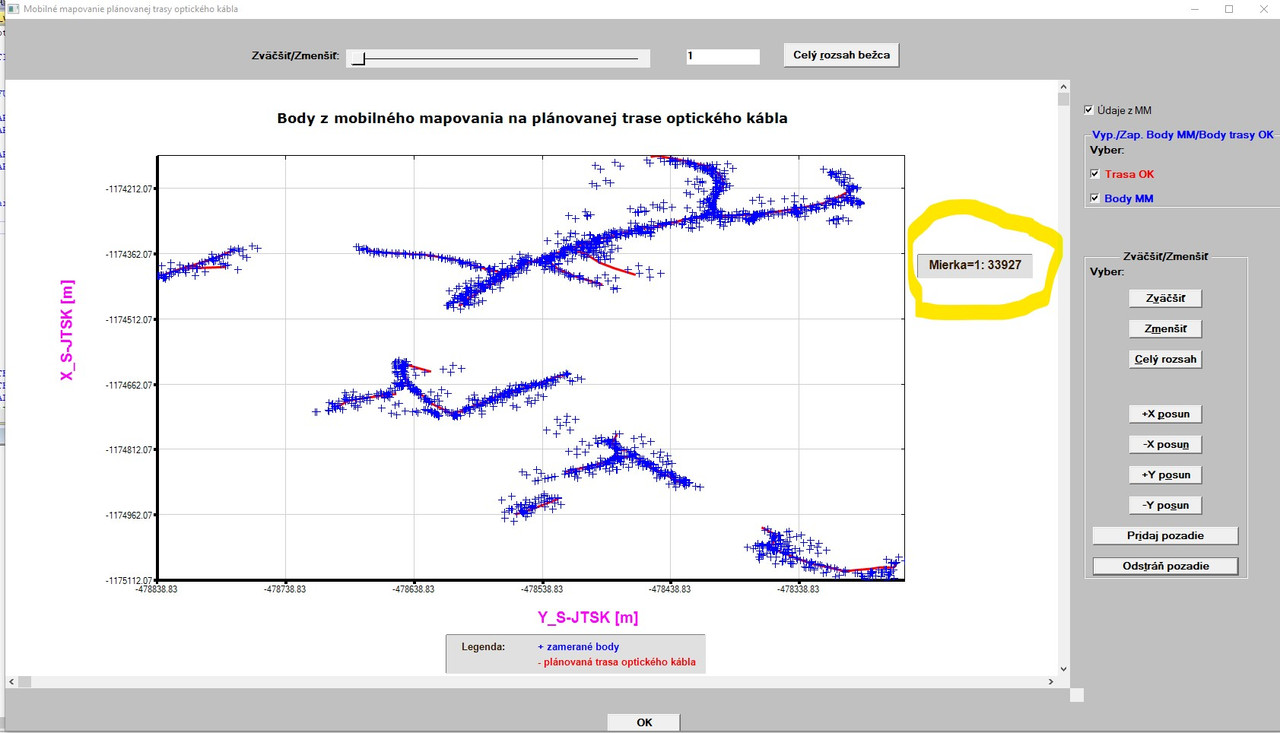
Based on your explanation I added automatic computation of graph´s scale, which is written next to the graph as can be seen below
(scale is an important and essential information for any surveyor when dealing with graphs/maps):
I plan to add to the graph above in the future also some statistical data for lines (like total line length, line length of each segment and maybe more simply
properties of each map´s object. I hope, I will be able to do it, since it requires quite extensive coding and the use of drawing functions of FTN95.
With respect to the scale in the graph above I have two simple questions:
1. As can be seen in the picture above, the computed scale is exact scale based on pixel and meter conversion (1px = 0.0002645833m) between two pairs of identical points having both pixel and real geodetic coordinates.
However, I would like to round it (since the scale like the one in the graph 1:33927 is very unusual).
Is there an intrinsic function in FTN95 (I do NOT mean ANINT/CEILING/FLOOR functions since it seems to me that they do not provide what I exactly want) which would round the number provided as argument to the whole tens or hundreds? (I mean for example to round the scale 1:33927 to 1:33900 or 1:34000).
Although, it would be a little bit deceptive, it looks much better.
2. I would also like to import to the graph a north sign (north arrow) which points to the north. Should I use the same functions (GET_DIB_SIZE@ and IMPORT_FILE_IMAGE@) like in the case of JPG import?
Regarding your answer to the item C and the link you provided: Thanks. The datum transformations and different map projections was/is my professional job. This was main topic of my dissertation of which practical result was a software called DatTra Datum Transformation which computes 3D transformations between global geocentric coordinate systems like WGS-84 (World Geodetic System 1984) and/or ETRF-89 (European Terrestrial Reference Frame 1989) and our local coordinate systems used in Slovakia (System of unified cadastral network S-JTSK, based on local Bessel´s ellipsoid and Krovak´s projection and a former military coordinate system S-42 (based on Krasovsky´s ellipsoid and Gauss-Kruger projection, which is similar to UTM Universal Transversal Mercator projection) and vice-versa. In the past, we had the DatTra package (of which I am main co-author) as standalone utility, but now we also have it in DLL version which can be built-in in any GIS software package. In fact, it is also built-in in such packages like ESRI ArcGIS or Q-GIS. They have a default transformation also for Slovakia, nevertheless it is not precise enough, so some customers in Slovakia with the highest requirements with respect to accuracy selected to built-in our DLL functionality.
With respect to the distortion of the raster JPG image overlayed in the graph of points/lines: I am afraid that it cannot be fully aligned, since the raster JPG is pure image with no coordinate association (therefore I suggested to have an option in %PL to load in a geo-referenced image). Maybe it can be reduced with much effort. |
|
| Back to top |
|
|
Kenneth_Smith
Joined: 18 May 2012
Posts: 697
Location: Hamilton, Lanarkshire, Scotland.
|
| Posted: Fri Mar 26, 2021 2:51 pm Post subject: |
|
|
Martin,
This may help, but the question of rounding numbers (particularly negative numbers) opens a "can of worms". This function round_n10 rounds to a power of 10 symmetrically about zero. Where the input data would cause an integer overflow, the returned number is simply returned unrounded.
| Code: | winapp
program rounding
implicit none
integer, parameter :: dp=kind(1.d0)
real(dp) x
integer i, p
x = 1234567.89123d0
print*, 'Positive x ', x
print*, 'Rounded to different powers of 10'
do p = -6, 6, 1
print*, p, round_n10( x, p), int(round_n10( x, p))
end do
x = -x
print*
print*, 'Negative x ', x
print*, 'Rounded to different powers of 10'
do p = -6, 6, 1
print*, p, round_n10( x, p), int(round_n10( x, p))
end do
print*
p = 2
do i = -52,-48, 1
x = i
print*, 'x =', x, 'p = ', p, round_n10( x, p), int(round_n10( x, p))
end do
print*
p = 2
do i = 48,52, 1
x = i
print*, 'x =', x, 'p = ', p, round_n10( x, p), int(round_n10( x, p))
end do
contains
real(dp) function round_n10(in,p)
real(dp), intent(in) :: in ! Number to be rounded
integer, intent(in) :: p ! Power of ten to which number is to be rounded
real(dp) a, b, e, t
e = (10.d0**(p))
if (in .gt. 0.d0 .or. in .lt. 0.d0) then
t = in/e
else
round_n10 = 0.d0
return
end if
if (abs(t) .ge. huge(1)) then ! Integer overflow case, no rounding applied
round_n10 = in
return
end if
a = nint(t)*e
b = -a + e
if (in .gt. 0.d0) b = a + e
round_n10 = a
if ( in - a .gt. b ) round_n10 = b
end function round_n10
end program rounding
|
|
|
| Back to top |
|
|
Kenneth_Smith
Joined: 18 May 2012
Posts: 697
Location: Hamilton, Lanarkshire, Scotland.
|
| Posted: Fri Mar 26, 2021 3:00 pm Post subject: |
|
|
Or more simply:-
| Code: | real*8 :: x = 33927.d0
print*, x
print*
print*, 1.d0 * NINT(x)
print*, 10.d0 * NINT(x / 10.d0 )
print*, 100.d0 * NINT(x / 100.d0 )
print*, 1000.d0 * NINT(x / 1000.d0)
end |
|
|
| Back to top |
|
|
Martin_K
Joined: 09 Apr 2020
Posts: 227
|
| Posted: Fri Mar 26, 2021 9:36 pm Post subject: |
|
|
Great Ken!
The one-line code for rounding is brilliant (to paraphrase a classic: all brilliant ideas and their beauty ground in their simplicity).
In the meantime, I added the logo for N/S/E/W directions as can be seen in the picture below (the letters in the logo are in slovakian: S=sever/north, J=juh/south, V=východ/east, Z=západ/west).
As can also be seen in the picture, I was able to adjust the JPG image exactly between the axes (what I also wanted). However, this was achieved (again) by experimenting only.
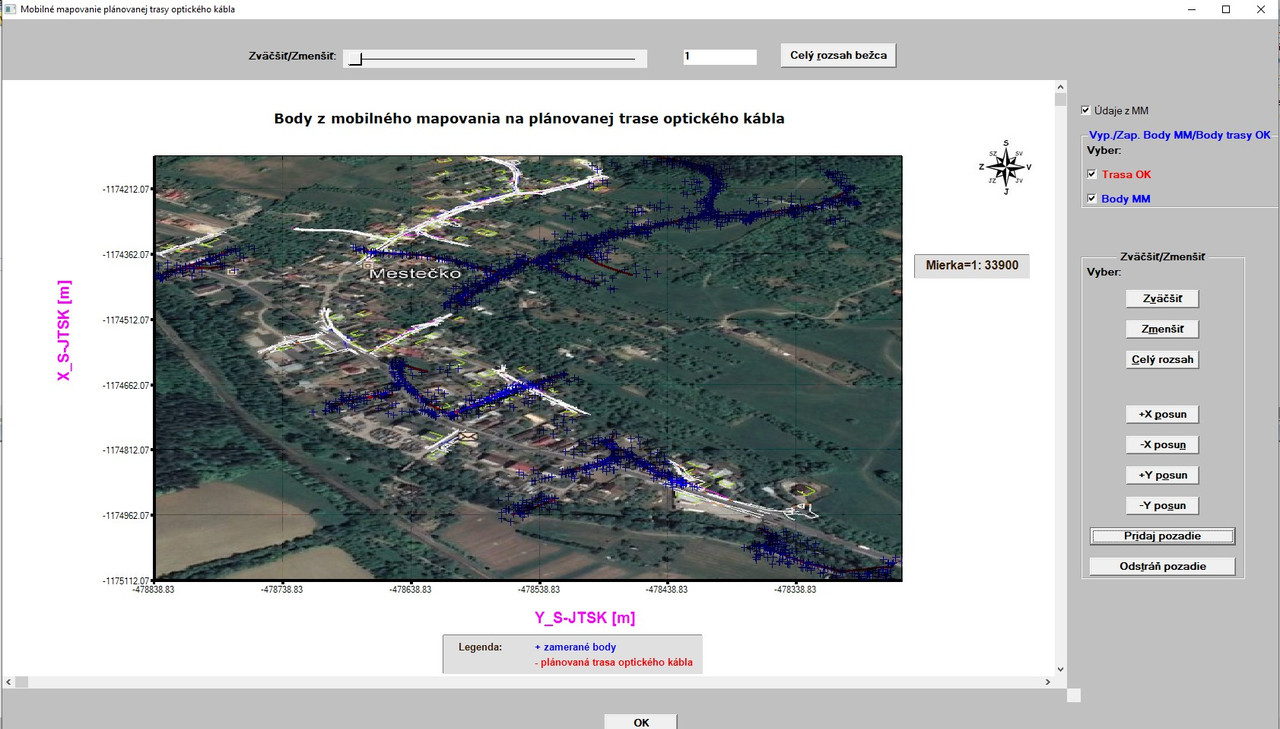
I use the code for adjusting JPG image in the graph (after its import using IMPORT_FILE_IMAGE@) as follows:
| Code: |
i = COPY_GRAPHICS_REGION@(handle_pl_OK, mright, mtop, gw-mleft-mright, gh-mtop-mbottom, &
1001, 0, 0, WIDTH_RASTER, HEIGHT_RASTER, 8913094)
|
where mright, mtop, mleft, mbottom are values for graph´s margins in all directions defined as parameters in declarations.
The same is valid also for GW (graph width) and GH (graph height). WIDTH_RASTER, HEIGHT_RASTER are values of JPG width and height provided by calling the function GET_DIB_SIZE@ (in my case WIDTH_RASTER=612 and HEIGHT_RASTER=575).
However, the code above never fitted the JPG exactly between X,Y axes. The JPG was always overlapping behind both axes a little bit (a picture in one of my previous post demonstrates it). I believe that the reason for it is that JPG was adjusted automatically taking also into account the number values indicated below tick marks on both axes as something which belongs to the graph area.
So, I manually adjusted the JPG image by using values -5,-5, then -10, -10 instead of 0,0 in the code above. It brought some improvements, but not 100%.
Therefore, I tried to experiment with the code:
| Code: |
i = IMPORT_FILE_IMAGE@( 'orthophoto_and_geo_surveying.jpg' , -10, -15 )
|
The code above with the offsets of -10, -15 works very well (see the picture above). Since the values X (in my case -10) and Y (in my case -15) represent the pixel offsets into the %PL graphics region I would like to know a general rule how to determine their right values automatically by the program before copying it to a selected %PL graphic region.
I tried some combination with the values I use for dw (1400),dh (800), mright (200), mleft (200), mtop (100), mbottom (125), WIDTH_RASTER (JPG) = 612 and HEIGHT_RASTER(JPG) = 575 to get the pixel offsets X,Y for IMPORT_FILE_IMAGE@, but I got never the values -10 and -15, which are the right values for this purpose. |
|
| Back to top |
|
|
Kenneth_Smith
Joined: 18 May 2012
Posts: 697
Location: Hamilton, Lanarkshire, Scotland.
|
| Posted: Fri Mar 26, 2021 11:30 pm Post subject: |
|
|
Martin,
Why is the second argument passed to COPY_GRAPHICS_REGION@ the variable MRIGHT?
Suggest you print out all the relevant variables so that you can do a manual check.
Also are you getting mixed up between gw, gh, and dw, dh ?
Is there a %pv in your code before the %pl? That might be causing problems since the graphics width and height of the %pl will change when the user resizes the window - I can see you have used %ww which permits this. |
|
| Back to top |
|
|
Martin_K
Joined: 09 Apr 2020
Posts: 227
|
| Posted: Sat Mar 27, 2021 12:28 am Post subject: |
|
|
Ken,
see my picture of how I understand the pixel coordinate system on the display in my post of Mon Mar 22, 2021 11:24 am in this conversation.
So, the WHOLE window area (it means whole size of the windows, where all these things are displayed) has the following dimensions:
width (gw) = 1400, height (gh) = 800
This size 1400x800 of the whole window includes all (caption of the window, graph itself and buttons to the right and also the OK button at the bottom).
The graph itself (where lines, points and raster JPG image are drawn and displayed) has the dimension of 1000x 575 since I used the margins mright=200, mleft=200, mtop=100 and mbottom=125 (so 1400-200-200=1000 and 800-100-125=575).
As I understand it, the origin of my drawing surface (area of 1000x575) has its pixel coordinates at the values MLEFT, MTOP. And YES, formally it is an error to use MRIGHT (my mistake - thanks for revealing it, I already corrected it to MLEFT, but in this specific case, it caused no harm due to the fact that MLEFT=MRIGHT=200). Therefore I used the variable MLEFT in the COPY_GRAPHICS_REGION@ as one of its offset values to be able to paste the top left corner of the JPG raster exactly on the top left corner of may graph area (on its origin).
Maybe I should somehow compute the SX, SY values, since in the copy function I use for them both ZERO values.
The dh is my typing error and is - in fact - gh (I do not use the dh variable in my program at all).
Although I use %ww, I have NO use of %pv within the whole program.
I will check all above mentioned variables once again by printing them out to visually confront their values - as you suggested.[/b] |
|
| Back to top |
|
|
Kenneth_Smith
Joined: 18 May 2012
Posts: 697
Location: Hamilton, Lanarkshire, Scotland.
|
| Posted: Sat Mar 27, 2021 1:16 am Post subject: |
|
|
OK, you have told me the same thing twice, and I thought it was incorrect the first time.
If width (gw) = 1400, height (gh) = 800 are the values used to define the %pl region, then this is not the size of the whole window.
These sizes define the size of the rectangular graphics area into which the %pl graph including its margins are drawn.
The buttons on the RHS and the OK button are not in the graphics region. They are in the ClearWin+ window, as is the %pl graphics region which has the dimensions specified in the winio@ call which sets up the %pl.
Here is a simple example, which draws two graphs sequentially. The size of the %pl graphics region is the same in each case, but the overall window size differs.
| Code: | WINAPP
USE clrwin
INTEGER N,im,gw,gh
PARAMETER(N=10,gw=600,gh=300)
REAL*8 x(N),y(N)
DO i=1,N
x(i)=0.1d0*(i-1)
y(i)=x(i)*x(i)
ENDDO
i=winio@('%ca[Quadratic]&')
i=winio@('%bg[blue]&')
i=winio@('%`bg[white]&')
CALL winop@("%pl[title=Graph,width=2,y_max=0.9,x_array,link=curves,symbol=9,colour=red,pen_style=2,framed]")
i=winio@('%pl&',gw,gh,N,x,y)
i=winio@('%sf%ff%nl%cn%tt[OK]')
i=winio@('%ca[Quadratic]&')
i=winio@('%bg[blue]&')
i=winio@('%`bg[white]&')
CALL winop@("%pl[title=Graph,width=2,y_max=0.9,x_array,link=curves,symbol=9,colour=red,pen_style=2,framed]")
i=winio@('%pl&',gw,gh,N,x,y)
i=winio@('%ta%ta%sf%tt[OK]')
END |
|
|
| Back to top |
|
|
Martin_K
Joined: 09 Apr 2020
Posts: 227
|
| Posted: Sat Mar 27, 2021 11:50 pm Post subject: |
|
|
Thanks Ken for your correction of my wrong imagination!
I will try to find out how to compute in the program the offsets
for imported JPG raster image (IMPORT_FILE_IMAGE@ offsets)
BEFORE pasting it on the graph to coincide exactly with the axes.
Now, I added some statistics to the graph (in yellow rectangle). All numbers there are variables extracted from input data:
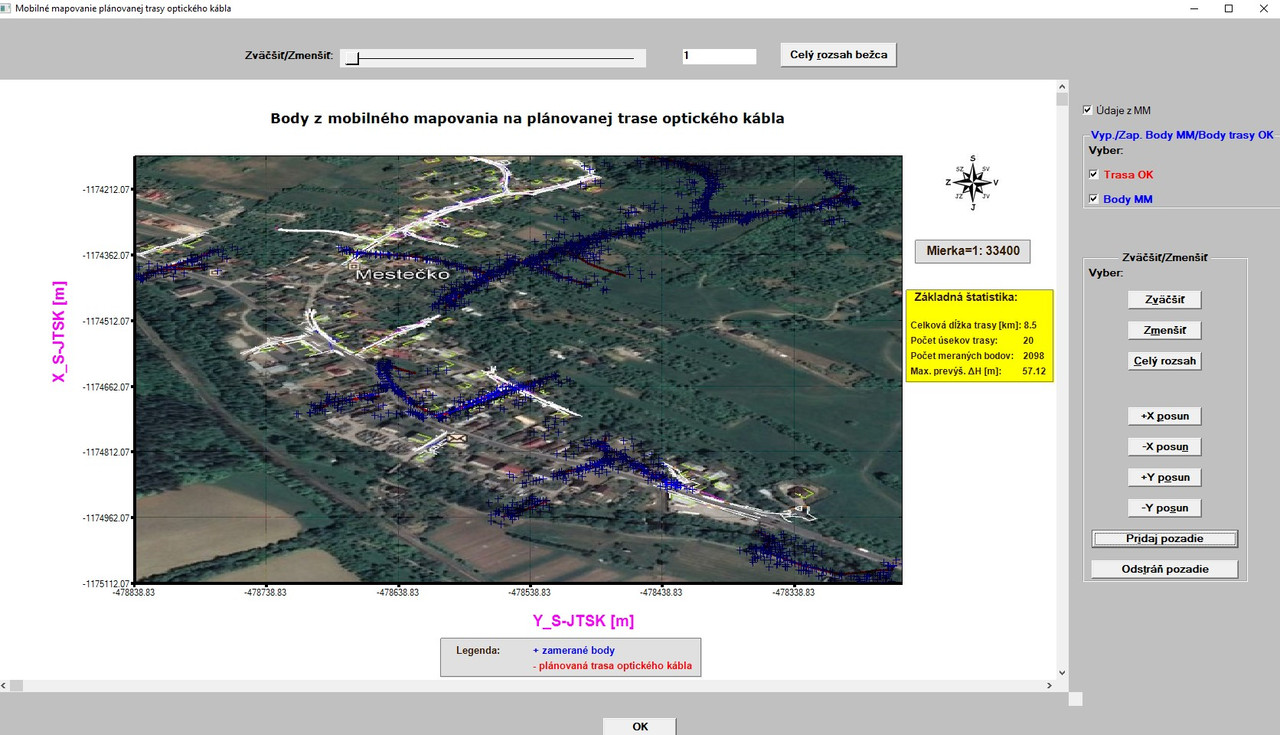
I would like to use different colors for the numbers (red for all) in the statistics (8.5 km is length of the route,
20 means different sections of the route, 2098 means number of surveyed points during mapping of the route and 57.12m is the maximum height difference between two points).
So the text would be black as it is now and the numbers (variables) would be in red.
I use the following code to write a string (for SCALE as example):
| Code: |
WRITE (output_string(5),fmt(5)) 'Mierka=1:', I_MIERKA
CALL draw_characters@(output_string(5),gw-190,mtop+130,rgb@(51,25,0))
|
How to achieve that the text will be in black (as is now) and the number would be in red when the function DRAW_CHARACTERS@ requires as its 4th argument
one color only and the text and the value (variable for scale) are both written to one output string (output_string(5)) ?
(I do not want to use 2 lines for it - one line for text in black and one line for the variable scale. This I can do with two colors. I want to have in one line two different colors).
Thanks in advance for some inspiration! |
|
| Back to top |
|
|
Kenneth_Smith
Joined: 18 May 2012
Posts: 697
Location: Hamilton, Lanarkshire, Scotland.
|
| Posted: Sun Mar 28, 2021 12:59 pm Post subject: |
|
|
Martin,
Split each of output strings into two strings, one with the description and one with the number values.
The first is written using draw_characters@(description(i),x,y,rgb@(0,0,0))
The second is draw_characters@(number(i),x+offset,y,rgb@(255,0,0))
In each case the x,y will be the current coordinates you are using, and offset chosen to align all the numerical values.
Note that the pixel length (and height) of x(i) is returned by GET_TEXT_SIZE@, but you need to use TRIM since the length returned by this includes trailing blank characters.
call GET_TEXT_SIZE@( trim(adjustl(txt))//achar(0),tw,th )
This could be used in a simple DO LOOP to determine automatically the length of the longest description string and this plus and extra few pixels determines your offset (and avoids some alignment problems when you change the descriptions at a later date [however the margin may be too small]).
Re: IMPORT_FILE_IMAGE@ offsets, since you don't have a %pv, I cannot see a reason why this is necessary. You might want to try a) importing a different file (size in pixels), and/or changing the %pl graphics size. The results, what ever they are may help pinpoint where the problem lies. Are gw and gh, as well as your margins truly global values, or do you have local declarations with the same name in some of your routines? For example, consider the chaos this example could result in:
| Code: | module t
implicit none
integer, parameter :: gw = 100
contains
integer function run1()
print*, 'gw = ',gw
run1=1
end function run1
integer function run2()
integer gw ! local declaration
gw = 2000
print*, 'gw = ',gw
run2=1
end function run2
end module t
program main
use t
i=run1()
i=run2()
i=run1()
end program main |
|
|
| Back to top |
|
|
|
|
You cannot post new topics in this forum
You cannot reply to topics in this forum
You cannot edit your posts in this forum
You cannot delete your posts in this forum
You cannot vote in polls in this forum
|
Powered by phpBB © 2001, 2005 phpBB Group
|

