 |
forums.silverfrost.com
Welcome to the Silverfrost forums
|
| View previous topic :: View next topic |
| Author |
Message |
Martin_K
Joined: 09 Apr 2020
Posts: 227
|
|
| Back to top |
|
 |
Martin_K
Joined: 09 Apr 2020
Posts: 227
|
 Posted: Tue Mar 16, 2021 9:23 pm Post subject: Posted: Tue Mar 16, 2021 9:23 pm Post subject: |
 |
|
Ken,
Thanks for your - as always - very useful tips/observations.
I will have a look at this!
A question:
Somehow, I was unable to understand how could I write a short code
for selecting an object in a graphic area by mouse click on it, which could
be used universally (for any graphic) and that it would be optically visible
in the graphic area, which object (point or line or area) was selected
and then - say - deselecting it by additional mouse click (left or right).
Is there a free code which would do it? |
|
| Back to top |
|
|
Kenneth_Smith
Joined: 18 May 2012
Posts: 820
Location: Lanarkshire, Scotland.
|
| Posted: Wed Mar 17, 2021 9:25 am Post subject: |
|
|
Martin,
See the following: https://www.silverfrost.com/ftn95-help/clearwinp/gdialog/graphicsicons.aspx
Using the basic ideas described there I was able to develop a graphics interface which allowed me to draw interactively an electrical network and extract its parameters and connectivity to a file for input to another program. |
|
| Back to top |
|
|
Martin_K
Joined: 09 Apr 2020
Posts: 227
|
| Posted: Wed Mar 17, 2021 7:08 pm Post subject: |
|
|
I had a look there some time ago, but was unsure whether it can be applied
also with %PL, since there is explicitly stated the %GR only.
So, can I use these features also with %PL or there is necessary to rewrite the code with %PL to %GR?
Now - an additional remark for Paul regarding my previous
suggestion for enhancing %PL capabilities.:
I still mulled how to simplify my second suggestion for the %PL enhancement (georeferencing of images in the graph) mentioned
earlier in this string of conversations and have the following
- I think, essentially simplified - idea:
Would it be realizable (with no huge effort and amount of time) to add a new option for the %PL like this:
%PL [image=filename.jpg]?
The purpose of this option would be to overlay current vector graphics
in the graph (like red lines and blue points in my case) with a pure jpg
image/picture (like in the case of %IM), with NO georeferencing,
hence no association with real geodetic coordinates which have the points/lines/areas in the graph.
I suppose, it would mean no complicated mathematics behind this.
The only requirement for such option would be that it
would have to stretch the image between X,Y axes in the graph.
Namely, I would be able to prepare a georeferenced orthophotomosaic
images in another software used for mobile mapping, which would at least roughly fit the area where
objects with real geodetic coordinates are located in the graph.
It would mean - at least - a roughly fit/coincide between the
image with no coordinate association a and objects in the graph with real geodetic coordinates.
Such option would just serve as a background source for the vector graphics in the graph. I think this would be very interesting enhancement.
Thanks for your evaluation of this idea and answer. |
|
| Back to top |
|
|
Kenneth_Smith
Joined: 18 May 2012
Posts: 820
Location: Lanarkshire, Scotland.
|
|
| Back to top |
|
|
PaulLaidler
Site Admin
Joined: 21 Feb 2005
Posts: 8220
Location: Salford, UK
|
| Posted: Thu Mar 18, 2021 8:10 am Post subject: |
|
|
| Very long standing. |
|
| Back to top |
|
|
Martin_K
Joined: 09 Apr 2020
Posts: 227
|
| Posted: Thu Mar 18, 2021 9:37 pm Post subject: |
|
|
I had a look at your code and this fulfills the basic idea - thanks, Ken!
But as always - it is rarely the case, when something works
with me on the first time and this is no exception.
So, I have a problem and a question.
PROBLEM:
I have the following plot function(using %PL) calling a callback (PL_CB) called by %PL (an extract of my code):
| Code: |
INTEGER FUNCTION plot_OK_MM ()
IMPLICIT NONE
iw = CREATE_GRAPHICS_REGION@(handle_internal_gr,gw,gh)
...
iw=winio@('%`^pl[vscroll,hscroll,full_mouse_input]&',gw,gh,n_pl,Y_OK_U,X_OK_U,handle_pl_ok,pl_cb)
...
iw=DELETE_GRAPHICS_REGION@(handle_internal_gr)
plot_OK_MM = 1
END FUNCTION plot_OK_MM
|
The callback PL_CB:
| Code: |
...
IF (cb_reason .eq. 'PLOT_ADJUST') THEN
...
i = COPY_GRAPHICS_REGION@(handle_internal_gr, 1, 1, gw, gh, handle_pl_OK, 1, 1, gw, gh, 13369376)
END IF
IF (cb_reason .eq. 'MOUSE_MOVE' ) THEN
i = COPY_GRAPHICS_REGION@(handle_pl_OK,1,1,gw,gh,handle_internal_gr,1,1,gw,gh,13369376)
ENDIF
...
|
Now, I use your code to display an image in the graph (I modified your code slightly):
| Code: |
INTEGER FUNCTION pridaj_raster ()
IMPLICIT NONE
INTEGER width_raster, height_raster, nbbp, ercode
INTEGER i
CALL GET_DIB_SIZE@( 'orthophoto_and_geo_surveying.jpg', WIDTH_RASTER, HEIGHT_RASTER, NBBP,ERCODE )
! i = NEW_GRAPHICS_REGION@( 1001, WIDTH_RASTER, HEIGHT_RASTER, rgb@(0,0,0))
i = IMPORT_FILE_IMAGE@( 'orthophoto_and_geo_surveying.jpg' , 0, 0 )
! i = COPY_GRAPHICS_REGION@(handle_pl_OK, 100, 100, gw, gh, &
! 1001, 0, 0, WIDTH_RASTER, HEIGHT_RASTER, 13369376)
! i = DELETE_GRAPHICS_REGION@(1001)
pridaj_raster = 2
END FUNCTION pridaj_raster
|
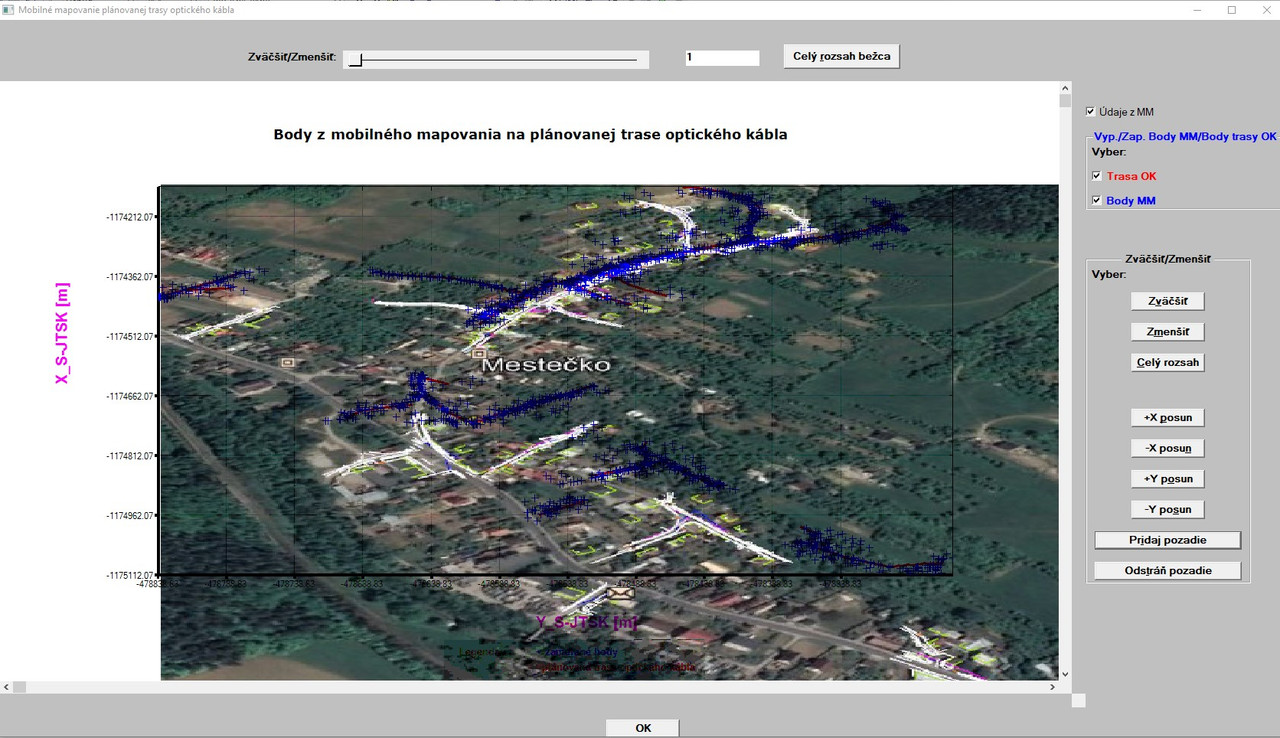
The result is that the image (file orthophoto_and_geo_surveying.jpg is loaded onto the graph BUT
it hides the vector graphic (lines and points are not visible, only the image) AND when I move with mouse over the graph area, the image automatically disappears.
QUESTION:
When the problem above will be solved, I thing that when I use the buttons zoom in/out/to extents and slider, all will be related to vector graphic only and the image will not be zoomed out/in.
How could it be resolved that also image file will be zoomed in/out/to extents along with vector graphic?
I could prevent the zooming in/out/to extents when image is displayed,
but if possible, it would be better to zoom in/out/to extents also the image. |
|
| Back to top |
|
|
Martin_K
Joined: 09 Apr 2020
Posts: 227
|
| Posted: Thu Mar 18, 2021 11:08 pm Post subject: |
|
|
Additional info to my previous post:
I already partially found why the raster JPG image automatically disappears when
I moved with mouse over the graph.
In the callback PL_CB called within %PL I originally used the code:
| Code: |
...
IF (cb_reason .eq. 'MOUSE_MOVE' ) THEN
i = COPY_GRAPHICS_REGION@(handle_pl_OK,1,1,gw,gh,handle_internal_gr,1,1,gw,gh,8913094) !!!13369376)
...
|
Now, instead 13369376 I used 8913094 and the image does NOT automatically disappear when moving with the mouse over the graph,
although after its initial loading the lines and points are still not automatically visible over the image. I have to move with the mouse over it
and then the lines and points are visible. The same is valid when I switch off the image and subsequently switch on it (first, I have to move
over graph to see the lines and points). However, when I make some zooming in/out/to extents (or any other actions relating to graph like switching off/on lines and points), the image displayed in the graph automatically disappears and must be reloaded again.
So, what is the real meaning of numbers 13369376 and 8913094 in this context and where I could find more details (all numbers and their meaning) for COPY_MODE? |
|
| Back to top |
|
|
Martin_K
Joined: 09 Apr 2020
Posts: 227
|
| Posted: Thu Mar 18, 2021 11:21 pm Post subject: |
|
|
And still: the use of 8913094 instead of 13369376 is no win-win situation:
when I use it (8913094) and I move over the graph with mouse the yellow rectangle, where the relevant data from surveyed points are extracted displayed is always present. It means when I point over a point, then on next and so on,
every yellow box remains permanently visible in the graph. |
|
| Back to top |
|
|
Kenneth_Smith
Joined: 18 May 2012
Posts: 820
Location: Lanarkshire, Scotland.
|
| Posted: Fri Mar 19, 2021 9:43 am Post subject: |
|
|
Martin,
Any call to simpleplot_redraw@ will remove the imported image as the %pl region is reformed. At this point you have to use COPY_GRAPHICS_REGION@ to repaste the image into the %pl graphics, before you call COPY_GRAPHICS_REGION@ to create a "back up" copy of the now modified %pl display which is used to let you display your moving yellow box.
To avoid continually calling IMPORT_IMAGE@, it would make sense to create a new permanent internal graphics region into which you import the image just once (permanent for the duration of the winio@ sequence that is associated with the %pl). Also, remember that IMPORT_IMAGE@ imports to the currently selected graphics region.
COPY_GRAPHICS_REGION@ will automatically rescale if the destination and source x/y ranges are different and since you can specify an x/y offset as well as width/height for both destination and source; this gives you a means of pasting a smaller region of the image when you have for example zoomed into an area of the graph - you know the %pl xmin/xmax/ymin/ymax values and you know the pixel width/height dimensions of the image as well as the physical origin and x/y extent coordinates the image refers to.
If your yellow box is permanently displayed you are creating the back up copy at the wrong point in the code. You just need to ensure that the copy operations are in the correct sequence. |
|
| Back to top |
|
|
Martin_K
Joined: 09 Apr 2020
Posts: 227
|
| Posted: Sat Mar 20, 2021 10:54 pm Post subject: |
|
|
Thanks Ken for your important remarks!
However, at this moment I have something wrong somewhere in the code
of one (or more?) of the three callbacks dealing with the graphics.
Their full code can be seen/downloaded here:
https://www.dropbox.com/s/ben76ov4n02ivs0/PL%2BCB.f95?dl=0
What I am getting now is this:
A short 10s video can be seen here:
https://www.dropbox.com/s/k12axnjebx21bzf/jpg_problem.mp4?dl=0
So, the facts are as follows:
1. I need the JPG to be displayed (stretched) ONLY between X,Y axes, not over the whole graph.
I have differences between source and destination widths and heights.
I tried it to adjust tentatively in a few iteration by specifying the offset
of the image - but I achieve practically nothing, moreover - I do not want to do it manually (to find the values of offset by manually and iteratively trying by typing in their estimated values, since this will always be different from one jpg to the another one).
So, in this particular case I would need to shorten (to squeeze) the image
both in north-south and east-west direction to get it between X,Y axes and I was unable to find how
(I would also need to specify an offset from right bottom corner).
2. As can be seen in the short video, when I load in the raster onto the graph and when I move with mouse (placed outside graph) back over the
graph, the image automatically disappears although I used the COPY_GRAPHICS_REGION@ from the buffer on the graph (the ID of the graph is variable handle_pl_OK and equals 0) also in the condition:
IF (cb_reason .eq. 'MOUSE_MOVE' ) THEN
which is in the PL_CB function called within %PL. |
|
| Back to top |
|
|
Kenneth_Smith
Joined: 18 May 2012
Posts: 820
Location: Lanarkshire, Scotland.
|
| Posted: Sun Mar 21, 2021 12:18 am Post subject: |
|
|
Looking only at your graphic above, I suspect that in your call to COPY_GRAPHICS_REGION@
Syntax
| Quote: | INTEGER FUNCTION COPY_GRAPHICS_REGION@(
+ DEST_GR, DX, DY, DWIDTH, DHEIGHT,
+ SRC_GR, SX, SY, SWIDTH, SHEIGHT, COPY_MODE )
INTEGER DEST_GR, DX, DY, DWIDTH, DHEIGHT,
+ SRC_GR, SX, SY, SWIDTH, SHEIGHT, COPY_MODE |
you need to subtract the width of the right %pl margin from the present value of DWIDTH, and the height of the bottom %pl margin from the present value of DHEIGHT.
DWIDTH should equal the width X of the %pl graphics region minus the sum of the widths of the left and right margins.
DHEIGHT should equal the depth Y of the %pl graphics region minus the sum of the heights of the top and bottom margins.
X,Y are defined in the %pl call
| Code: | | i= winio@('%pl&',Npoints,X,Y) |
DX should equal the width of the left margin.
DY should equal the height of the top margin.
If you have not explicitly specified the margins, use the %pl[margin] option.
[margin=d] Specifies the margin value in pixels for all margins.
[margin=(d,d,d,d)] Specifies values in pixels for the left, top, right and bottom margins.
| Code: | module demo_margin
use clrwin
implicit none
integer, parameter :: dp=kind(1.d0)
integer, parameter :: mtop = 20, mbottom=300, mleft=300, mright=30
integer, parameter :: npoints = 20
real(kind=dp) :: x(1:npoints),y(1:npoints)
contains
integer function draw_pl()
integer i, iw
character(len=126) pl_str
do i = 1, npoints,1
x(i) = i-1
y(i) = (i-1)*(i-1)
end do
iw = winio@('%mn[Exit]&','exit')
call winop@('%pl[native,x_array,independent,frame,gridlines]')
write(pl_str,'("%pl[margin=(",I3,",",I3,",",I3,",",I3,")]")') mleft, mtop, mright, mbottom
call winop@(pl_str)
iw = winio@('%pl&',1000,800,npoints,x,y)
iw = winio@(' ')
draw_pl =1
end function draw_pl
end module demo_margin
program main
use demo_margin
implicit none
integer i
i = draw_pl()
end program main |
|
|
| Back to top |
|
|
Kenneth_Smith
Joined: 18 May 2012
Posts: 820
Location: Lanarkshire, Scotland.
|
| Posted: Sun Mar 21, 2021 10:29 pm Post subject: |
|
|
John,
Only in the sense that it's sufficiently long to avoid character buffer errors for something like:
'%pl[x_min=-1000.0,x_max=+1000,dx=100,x_sigfigs=2,y_min=-1000.0,y_max=+1000,dy=100,y_sigfigs=2]' |
|
| Back to top |
|
|
Martin_K
Joined: 09 Apr 2020
Posts: 227
|
| Posted: Mon Mar 22, 2021 11:24 am Post subject: |
|
|
Thanks Ken!
I read the section regarding the COPY_GRAPHICS_REGION@ many times in the on-line manual (which also you pasted in your previous post), but due to its vague formulation I did not understand it as a whole, since I did not know what is the real meaning of DX,DY and SX,SY values. Now, thanks to your explanation I know that he values DX,DY,SX,SY represent margins.
Nevertheless, I still have couple of questions. Please � have a look at the picture below (outlined a pixel coordinate system):
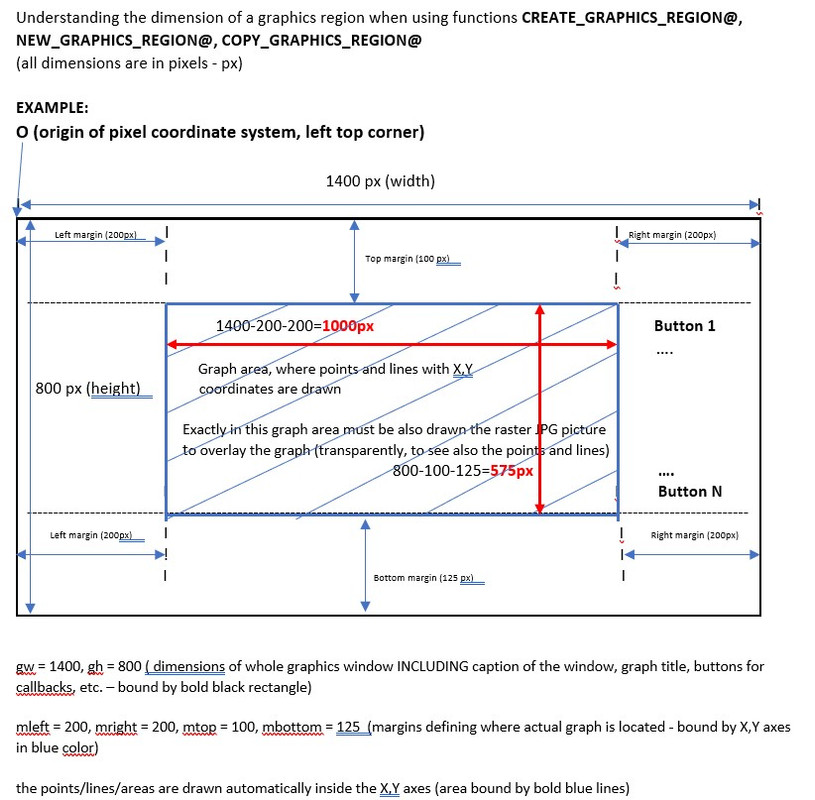
If my understanding (imagination) of a pixel coordinate system pictured above is correct (if not, correct me) the questions are:
A)
I defined the whole window area (DW,DH dimensions: 1400x800) to accommodate all texts, buttons, titles, caption, graphs but with NO margin option for the %PL (I did not use the option margin at all). The graph itself, where points and lines are drawn, was automatically created by %PL and bound by X,Y axes. This graph is smaller than 1400x800 window.
How can I automatically (by program or an option in %PL) detect the pixel coordinates of at least one corner of the graph (say � top left) bound by X,Y axes, where the input data (points) are drawn?
The procedure with GUESSING the offsets is not usable.
B)
When I loaded in the raster jpg image, it was placed within whole white area of the graph (overlaying graph title, X,Y captions and legend). This was � of coarse � not wanted, so I started to try to lower the image dimensions. Unfortunately, I did it manually, tentatively and in few iterations (I started to use the DX, DY values (margins) with 120, 80 � it did not fit, then I used 150, 90, it did not fit and finally � I guessed!!! the correct DX, DY values (200,200), where the top left corner of the vector graphs coincided with top-left corner of the loaded raster image. But this was all, no other dimension coincided, so I posted my questions in my previous post. Based on your answer, I used the MARGIN option for %PL and the result can be seen below:
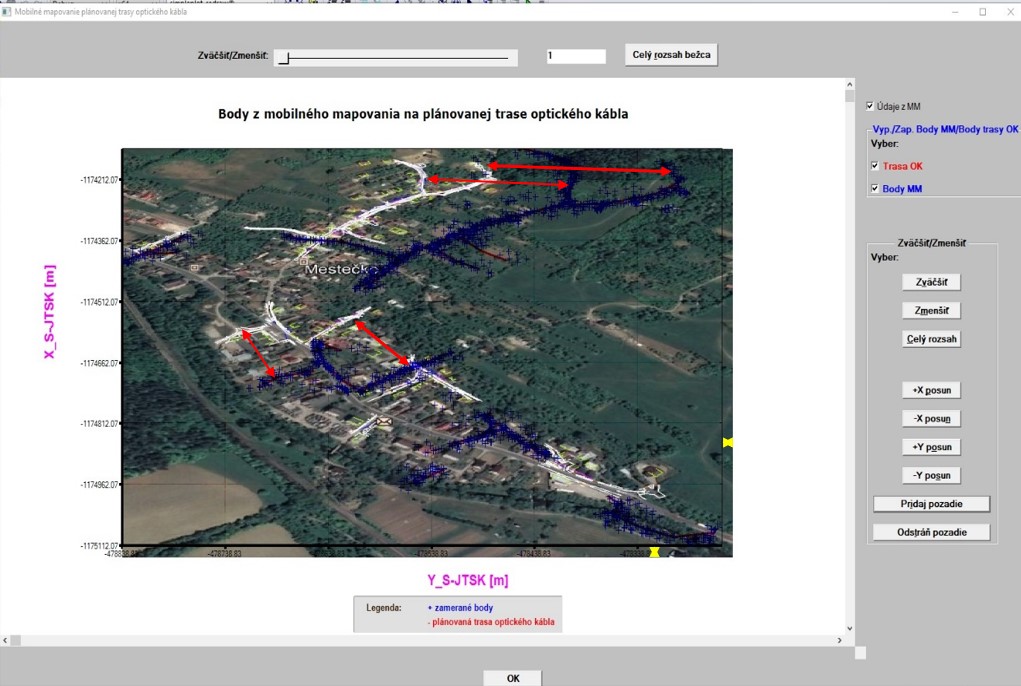
I used the code (for adjusting raster image to vector graph):
| Code: |
i = COPY_GRAPHICS_REGION@(handle_pl_OK, 200, 100, gw-mleft-mright, gh-mtop-mbottom, &
1001, 0, 0, WIDTH_RASTER, HEIGHT_RASTER, 8913094)
|
It nearly fits, although not 100% (see two yellow lines in the picture to the bottom right). I could lower it in both directions by value 10 (it would then fit quite good) but then there remain 2 black strips (horizontally and vertically).
The question is:
Why � when using GW-MLEFT-MRIGHT and GH-MTOP-MBOTTOM � the image does not coincide exactly to the graph within X,Y bounds?
C)
Moreover, although the image was created by me a few months ago, at that time with no intention to use it for such purposes like now, you can see in the picture above (see red lines with arrows) very big displacement of the data when comparing them to the image background). I can investigate how could I create the IMAGE as a raster with no association to real geodetic coordinates in my mobile mapping processing software (where all is treated exclusively and ONLY in real geodetic coordinates and in real geodetic coordinate system), however � I am afraid that this way to overlay the vector data (with real geodetic coordinates) in the graph with an un-georeferenced image (with no coordinate association) is the way to nowhere, impassable and closed.
Nevertheless, it would be great to introduce an internal function like GET_DATA_SCALE@ which would output the graph scale (which scale in the graph is used for the drawn data by %PL. All maps have a scale like: 1:500, 1:1000, 1:10000, � Or to have a possibility to specify a particular scale info to %PL (I do not mea |
|
| Back to top |
|
|
Martin_K
Joined: 09 Apr 2020
Posts: 227
|
| Posted: Mon Mar 22, 2021 12:22 pm Post subject: |
|
|
still last sentence of my previous post:
I do not mean current scale options for %PL like SCALE=LINEAR,� I mean to tell %PL to draw all input data in linear scale � let say � 1:1000, it means SCALE=1000 or SCALE = 500, �). |
|
| Back to top |
|
|
|
|
You cannot post new topics in this forum
You cannot reply to topics in this forum
You cannot edit your posts in this forum
You cannot delete your posts in this forum
You cannot vote in polls in this forum
|
Powered by phpBB © 2001, 2005 phpBB Group
|

