 |
forums.silverfrost.com
Welcome to the Silverfrost forums
|
| View previous topic :: View next topic |
| Author |
Message |
Kenneth_Smith
Joined: 18 May 2012
Posts: 818
Location: Lanarkshire, Scotland.
|
 Posted: Thu May 21, 2020 10:07 am Post subject: Posted: Thu May 21, 2020 10:07 am Post subject: |
 |
|
Martin,
Obviously, you cannot snap the mouse since that�s the input device.
However, if you have successfully decoded the nearest grid point to the current mouse position (which I assume yesterday�s question was about), instead of the %pl call back writing the current position to the graphics area, it could:
1) draw a symbol at the nearest grid point, e.g. draw_filled_ellipse@
2) write the coordinates of the nearest grid point and other data, offset from the ellipse.
A few points to note:
1. Origin of graphics area is top left, so graphics coordinates work in the 4th quadrant.
2. draw_filled_ellipse@ will draw a filled circle with equal input major and minor diameters.
With this approach, as the user moves the mouse horizontally across the screen a series of circles will appear, giving the impression of the mouse snapping to a grid point.
Ken |
|
| Back to top |
|
 |
Kenneth_Smith
Joined: 18 May 2012
Posts: 818
Location: Lanarkshire, Scotland.
|
| Posted: Thu May 21, 2020 2:21 pm Post subject: |
|
|
This demonstrates the process I described in my previous post. The nearest grid point to the mouse is highlighted and some information related to this is displayed on the screen.
| Code: | module example
use clrwin
implicit none
integer, parameter :: dp=kind(1.d0), gw = 1000, gh = 800, N=20
integer :: handle_internal_gr = 1, handle_pl = 2
real(kind=dp) :: x_array(1:N), y_array(1:N)
integer :: xy(1:N*N,1:N*N) = 0
real(kind=dp) :: x_pl(1:N*N), y_pl(1:N*N), dx(1:N*N)
contains
integer function generate_data()
integer i,j,k
x_array(1) = -5.d0
y_array(1) = -5.d0
do i = 2, N
x_array(i) = x_array(i-1) + 1.d0 ; y_array(i) = y_array(i-1) + 1.d0
end do
i = 1 ; j = 1
do while (i .le. N*N)
do j = 1, N, 1
do k = 1, N, 1
x_pl(i) = x_array(j) ; y_pl(i) = y_array(k)
xy(j,k) = i ! use this to access other information associated with the grid point.
dx(i) = random@() ; i = i + 1 ! for example a dx value
end do
end do
end do
generate_data = 2
end function generate_data
integer function plot()
integer, save :: iw
iw = CREATE_GRAPHICS_REGION@(handle_internal_gr,gw,gh )
if ( iw .ne. 1) STOP 'Failed to create internal graphics region'
iw = winio@('%mn[Close]&','Exit')
iw = winio@('%`bg[white]&')
call winop@('%pl[independent,x_array,link=none,symbol=6,gridlines,frame]')
iw = winio@('%`^pl[full_mouse_input]&',gw,gh,N*N,x_pl,y_pl, handle_pl, pl_cb)
iw = winio@(' ')
iw = DELETE_GRAPHICS_REGION@(handle_internal_gr)
plot = 2
end function plot
integer function pl_cb()
character(len=30) cb_reason
integer(kind=7) i,j,k, x1p, y1p
real(kind=dp) x1r,y1r
character(len=30) output_string
cb_reason = clearwin_string@('callback_reason')
if (cb_reason .eq. 'PLOT_ADJUST') i = COPY_GRAPHICS_REGION@(handle_internal_gr, 1, 1, gw, gh, handle_pl, 1, 1, gw, gh, 13369376 )
if (cb_reason .eq. 'MOUSE_MOVE' ) then
x1p = CLEARWIN_INFO@('GRAPHICS_MOUSE_X') ; y1p = CLEARWIN_INFO@('GRAPHICS_MOUSE_Y')
i = GET_PLOT_DATA@(x1p,y1p,x1r,y1r)
j = minloc(abs(x_array - x1r), 1) ; k = minloc(abs(y_array - y1r), 1)
i = COPY_GRAPHICS_REGION@(handle_pl, 1, 1, gw, gh, handle_internal_gr, 1, 1, gw, gh, 13369376 )
i = GET_PLOT_POINT@(x_array(j),y_array(k),x1r,y1r) !returns real*8 not integer
x1p = nint(x1r) ; y1p = nint(y1r)
call draw_filled_ellipse@(x1p,y1p,8,8,rgb@(255,0,0))
write(output_string,'(A2,1X,F5.3)') 'dx',dx(xy(j,k))
call draw_filled_rectangle@(x1p+10, y1p+10, x1p+140+10, y1p+20+10, rgb@(255,255,0))
call draw_characters@(output_string, x1p+10, y1p+10, rgb@(0,0,0))
end if
pl_cb = 2
end function pl_cb
end module example
program main
use example
implicit none
integer i
i = generate_data() ; i = plot()
end program main |
|
|
| Back to top |
|
|
DanRRight
Joined: 10 Mar 2008
Posts: 2927
Location: South Pole, Antarctica
|
| Posted: Thu May 21, 2020 5:53 pm Post subject: Re: |
|
|
| Martin_K wrote: | Paul, would be thinkable in near future to add to the %PL an option like
[Point/Line Attributes/Description] which would take the attributes of each concrete point (like Point ID and its description like code or comment) if they were present at the point and would display such information in the graphic when hovering over the point with the cursor? I mean as simple as possible without the need of extensive programming with such option. |
Since %pl is compatible with the %gr it is possible to make what you ask using just Clearwin capabilities. In previous post Ken showed that with yellow rectangle, I have done that by opening instead a small flyer which is standard Clearwin text/graphics window with the shadow without typical Windows frame where you can type and plot everything you want. When mouse moves the window is destroyed and appears in the new place as soon as movement stops. With the window transparency manipulation (ask Eddie how it is done with just few lines of text. In 32bit it worked but I lost this capability in 64bits) the transition could be super cool, the flyer window will appear and disappear smoothly. All looks like in the best homes of Paris and London.
And I agree with you that Clearwin has to include the option to click on the window and change anything by mouse and keyboard. To move margins, change LOG to Linear, chose different variable to plot, change number of plotted curves, basically change everything. I wrote about this in the past. This could become the UltimatePlot with ultimate simplicity and versatility beating even MATLAB and requiring no Fortran programming at all besides just one line in the Fortran source:
| Code: | | I=winio('%pl', filenameSettings221) |
where filenameSettings221 is the user defined settings for graph number 221 like we do with WINOP which will be saved after user sets everything. First time you run the code it opens general setup window where using just the mouse you set the new plot, this one line of text may have access to all arrays in the code and you just select any available in the scope. Next time code run through this place, it will read filenameSetting221 file and plots the graph. And moving axis of plot has to be done just by mouse click and drag for example without any programming. All the settings for the flyer mentioned above in my case also were at just the mouse pointer and click. I have done that with Clearwin %gr 20 years ago with just the Fortran and nothing else. How profi at Silverfrost can miss such opportunity ? This is just one month of heavy programming work and then a year of perfection and bug fixes after which it's just basically some minor support |
|
| Back to top |
|
|
Kenneth_Smith
Joined: 18 May 2012
Posts: 818
Location: Lanarkshire, Scotland.
|
| Posted: Fri May 22, 2020 10:24 am Post subject: |
|
|
Do you really need plot the grid points and hence require to pass the large arrays with the grid points to %pl?
In this example there are just two 2 points to define the full extent of the grid.
Part 1
| Code: |
use clrwin
implicit none
integer, parameter :: dp=kind(1.d0), gw = 1000, gh = 800, N=11
integer :: handle_internal_gr = 1, handle_pl = 2
real(kind=dp) :: x_array(1:N), y_array(1:N)
integer :: xy(1:N*N,1:N*N) = 0
!real(kind=dp) :: x_pl(1:N*N), y_pl(1:N*N)
real(kind=dp) :: dx(1:N*N), dy(1:N*N), x_pl2(1:2), y_pl2(1:2)
contains
integer function generate_data()
integer i,j,k
x_array(1) = -5.d0 ; y_array(1) = -5.d0
do i = 2, N
x_array(i) = x_array(i-1) + 1.d0 ; y_array(i) = y_array(i-1) + 1.d0
end do
i = 1 ; j = 1
do while (i .le. N*N)
do j = 1, N, 1
do k = 1, N, 1
! x_pl(i) = x_array(j) ; y_pl(i) = y_array(k)
xy(j,k) = i ; dx(i) = random@() ; dy(i) = random@() ; i = i + 1
end do
end do
end do
x_pl2(1) = minval(x_array) ; x_pl2(2) = maxval(x_array)
y_pl2(1) = minval(y_array) ; y_pl2(2) = maxval(y_array)
generate_data = 2
end function generate_data
integer function plot()
integer, save :: iw
iw = CREATE_GRAPHICS_REGION@(handle_internal_gr,gw,gh )
if ( iw .ne. 1) STOP 'Failed to create internal graphics region'
iw = winio@('%mn[Close]&','Exit')
iw = winio@('%`bg[white]&')
call winop@('%pl[independent,x_array,link=none,symbol=12,symbol_size=1,colour=white,gridlines,frame]')
iw = winio@('%`^pl[full_mouse_input]&',gw,gh,2,x_pl2,y_pl2, handle_pl, pl_cb)
iw = winio@(' ')
iw = DELETE_GRAPHICS_REGION@(handle_internal_gr)
plot = 2
end function plot |
Last edited by Kenneth_Smith on Fri May 22, 2020 11:17 am; edited 2 times in total |
|
| Back to top |
|
|
Kenneth_Smith
Joined: 18 May 2012
Posts: 818
Location: Lanarkshire, Scotland.
|
| Posted: Fri May 22, 2020 10:25 am Post subject: |
|
|
Part 2
| Code: |
integer function pl_cb()
character(len=30) cb_reason
integer i,j,k, x1p, y1p
real(kind=dp) x1r,y1r
character(len=30) output_string(4)
cb_reason = clearwin_string@('callback_reason')
if (cb_reason .eq. 'PLOT_ADJUST') i = COPY_GRAPHICS_REGION@(handle_internal_gr, 1, 1, gw, gh, handle_pl, 1, 1, gw, gh, 13369376 )
if (cb_reason .eq. 'MOUSE_MOVE' ) then
x1p = CLEARWIN_INFO@('GRAPHICS_MOUSE_X') ; y1p = CLEARWIN_INFO@('GRAPHICS_MOUSE_Y')
i = GET_PLOT_DATA@(x1p,y1p,x1r,y1r)
write(output_string(1),'(F7.3,1A,F7.3)') x1r,',',y1r
j = minloc(abs(x_array - x1r), 1) ; k = minloc(abs(y_array - y1r), 1)
write(output_string(2),'(F7.3,1A,F7.3)') x_array(j),',',y_array(k)
i = COPY_GRAPHICS_REGION@(handle_pl, 1, 1, gw, gh, handle_internal_gr, 1, 1, gw, gh, 13369376 )
i = GET_PLOT_POINT@(x_array(j),y_array(k),x1r,y1r) !returns real*8 not integer
x1p = nint(x1r) ; y1p = nint(y1r)
! call draw_filled_ellipse@(x1p,y1p,8,8,rgb@(255,0,0))
call draw_grid_point(x1p,y1p,16,rgb@(255,0,0))
i = xy(j,k)
write(output_string(3),'(A2,1X,F7.3)') 'dx',dx(i)
write(output_string(4),'(A2,1X,F7.3)') 'dy',dy(i)
call draw_filled_rectangle@(x1p+10, y1p+10, x1p+140+10, y1p+20+60, rgb@(255,255,0))
call draw_rectangle@(x1p+10, y1p+10, x1p+140+10, y1p+20+60, rgb@(0,0,0))
call draw_characters@(output_string(1), x1p+10, y1p+15, rgb@(0,0,0))
call draw_characters@(output_string(2), x1p+10, y1p+30, rgb@(255,0,0))
call draw_characters@(output_string(3), x1p+10, y1p+45, rgb@(0,0,255))
call draw_characters@(output_string(4), x1p+10, y1p+60, rgb@(0,0,255))
end if
pl_cb = 2
end function pl_cb
subroutine draw_grid_point(x,y,size,colour)
integer, intent(in):: x,y,size,colour
integer k
call set_line_width@(2)
call draw_line_between@(x-size,y,x+size,y,colour) ; call draw_line_between@(x,y-size,x,y+size,colour)
k = nint(dble(size)/2.d0) ; call draw_ellipse@(x,y,k,k,colour)
end subroutine draw_grid_point
end module example
program main
use example
implicit none
integer i
i = generate_data() ; i = plot()
end program main |
|
|
| Back to top |
|
|
Kenneth_Smith
Joined: 18 May 2012
Posts: 818
Location: Lanarkshire, Scotland.
|
| Posted: Fri May 22, 2020 11:55 am Post subject: |
|
|
Or if you want to retain the concept of there being a grid around the selected points, something like this perhaps.
| Code: | module example
use clrwin
implicit none
integer, parameter :: dp=kind(1.d0), gw = 1000, gh = 800, N=11
integer :: handle_internal_gr = 1, handle_pl = 2
real(kind=dp) :: x_array(1:N), y_array(1:N), dx(1:N*N), dy(1:N*N), x_pl2(1:2), y_pl2(1:2)
integer :: xy(1:N*N,1:N*N) = 0
contains
integer function generate_data()
integer i,j,k
x_array(1) = -5.d0 ; y_array(1) = -5.d0
do i = 2, N
x_array(i) = x_array(i-1) + 1.d0 ; y_array(i) = y_array(i-1) + 1.d0
end do
i = 1 ; j = 1
do while (i .le. N*N)
do j = 1, N, 1
do k = 1, N, 1
xy(j,k) = i ; dx(i) = random@() ; dy(i) = random@() ; i = i + 1
end do
end do
end do
x_pl2(1) = minval(x_array) ; x_pl2(2) = maxval(x_array)
y_pl2(1) = minval(y_array) ; y_pl2(2) = maxval(y_array)
generate_data = 2
end function generate_data
integer function plot()
integer, save :: iw
iw = CREATE_GRAPHICS_REGION@(handle_internal_gr,gw,gh )
if ( iw .ne. 1) STOP 'Failed to create internal graphics region'
iw = winio@('%mn[Close]&','Exit')
iw = winio@('%`bg[white]&')
call winop@('%pl[independent,x_array,link=none,symbol=12,symbol_size=1,colour=white,gridlines,frame]')
iw = winio@('%`^pl[full_mouse_input]&',gw,gh,2,x_pl2,y_pl2, handle_pl, pl_cb)
iw = winio@(' ')
iw = DELETE_GRAPHICS_REGION@(handle_internal_gr)
plot = 2
end function plot |
|
|
| Back to top |
|
|
Kenneth_Smith
Joined: 18 May 2012
Posts: 818
Location: Lanarkshire, Scotland.
|
| Posted: Fri May 22, 2020 11:56 am Post subject: |
|
|
Part 2.
| Code: |
integer function pl_cb()
character(len=30) cb_reason
integer i,j,k, x1p, y1p, jj, kk
real(kind=dp) x1r,y1r, x1rr, y1rr
character(len=30) output_string(4)
character(len=20), parameter :: fmt1='(SP,F7.3,1A,F7.3) ', fmt2='(SP,2X,A2,1X,F7.3) '
cb_reason = clearwin_string@('callback_reason')
if (cb_reason .eq. 'PLOT_ADJUST') i = COPY_GRAPHICS_REGION@(handle_internal_gr, 1, 1, gw, gh, handle_pl, 1, 1, gw, gh, 13369376 )
if (cb_reason .eq. 'MOUSE_MOVE' ) then
x1p = CLEARWIN_INFO@('GRAPHICS_MOUSE_X') ; y1p = CLEARWIN_INFO@('GRAPHICS_MOUSE_Y')
i = GET_PLOT_DATA@(x1p,y1p,x1r,y1r)
write(output_string(1),fmt1) x1r,',',y1r
j = minloc(abs(x_array - x1r), 1) ; k = minloc(abs(y_array - y1r), 1)
write(output_string(2),fmt1) x_array(j),',',y_array(k)
i = COPY_GRAPHICS_REGION@(handle_pl, 1, 1, gw, gh, handle_internal_gr, 1, 1, gw, gh, 13369376 )
i = GET_PLOT_POINT@(x_array(j),y_array(k),x1r,y1r) !returns real*8 not integer
x1p = nint(x1r) ; y1p = nint(y1r)
call draw_grid_point(x1p,y1p,16,rgb@(255,0,0),1)
do jj = j - 1, j + 1, 1
do kk = k - 1, k + 1, 1
if (jj .lt. 1) then ; cycle
else if (kk .lt. 1) then ; cycle
else if (kk .gt. size(x_array)) then ; cycle
else if (jj .gt. size(y_array)) then ; cycle
else if (jj .eq. j .and. kk .eq. k) then ; cycle
else
i = GET_PLOT_POINT@(x_array(jj),y_array(kk),x1rr,y1rr)
call draw_grid_point(nint(x1rr),nint(y1rr),8,rgb@(200,200,200),0)
end if
end do
end do
i = xy(j,k)
write(output_string(3),fmt2) 'dx',dx(i)
write(output_string(4),fmt2) 'dy',dy(i)
call draw_filled_rectangle@(x1p+10, y1p+10, x1p+150+10, y1p+20+60, rgb@(255,255,0))
call draw_rectangle@(x1p+10, y1p+10, x1p+150+10, y1p+20+60, rgb@(125,125,125))
call draw_characters@(output_string(1), x1p+10, y1p+15, rgb@(0,0,0))
call draw_characters@(output_string(2), x1p+10, y1p+30, rgb@(255,0,0))
call draw_characters@(output_string(3), x1p+10, y1p+45, rgb@(0,0,255))
call draw_characters@(output_string(4), x1p+10, y1p+60, rgb@(0,0,255))
end if
pl_cb = 2
end function pl_cb
subroutine draw_grid_point(x,y,size,colour,flag)
integer, intent(in):: x,y,size,colour,flag
integer k
call set_line_width@(2)
call draw_line_between@(x-size,y,x+size,y,colour) ; call draw_line_between@(x,y-size,x,y+size,colour)
if (flag .eq. 1) then ; k = nint(dble(size)/2.d0) ; call draw_ellipse@(x,y,k,k,colour) ; end if
end subroutine draw_grid_point
end module example
program main
use example
implicit none
integer i
i = generate_data() ; i = plot()
end program main |
|
|
| Back to top |
|
|
Martin_K
Joined: 09 Apr 2020
Posts: 227
|
| Posted: Sun May 24, 2020 9:27 pm Post subject: |
|
|
Ken,
AFTER implementing your code showing the real geodetic X,Y values with the cursor I have a problem with the grid as follows (see picture below): The grid is automatically displayed (the box next to Mrie�ka(Grid) is checked by default). When I uncheck this box (see the picture below, top right), grid will dismiss for a while (10-12 sec.) and then automatically re-appears without my action (and so on around). I tried many changes with no success. I think that it is connected with CREATE_GRAPHICS_REGION@ function. Before implementing the displaying of geodetical coordinates with cursor (when NO CREATE_GRAPHICS_REGION@ was present in the code) it worked (box checked - grid displayed, box unchecked - grid disappeared).
[img]
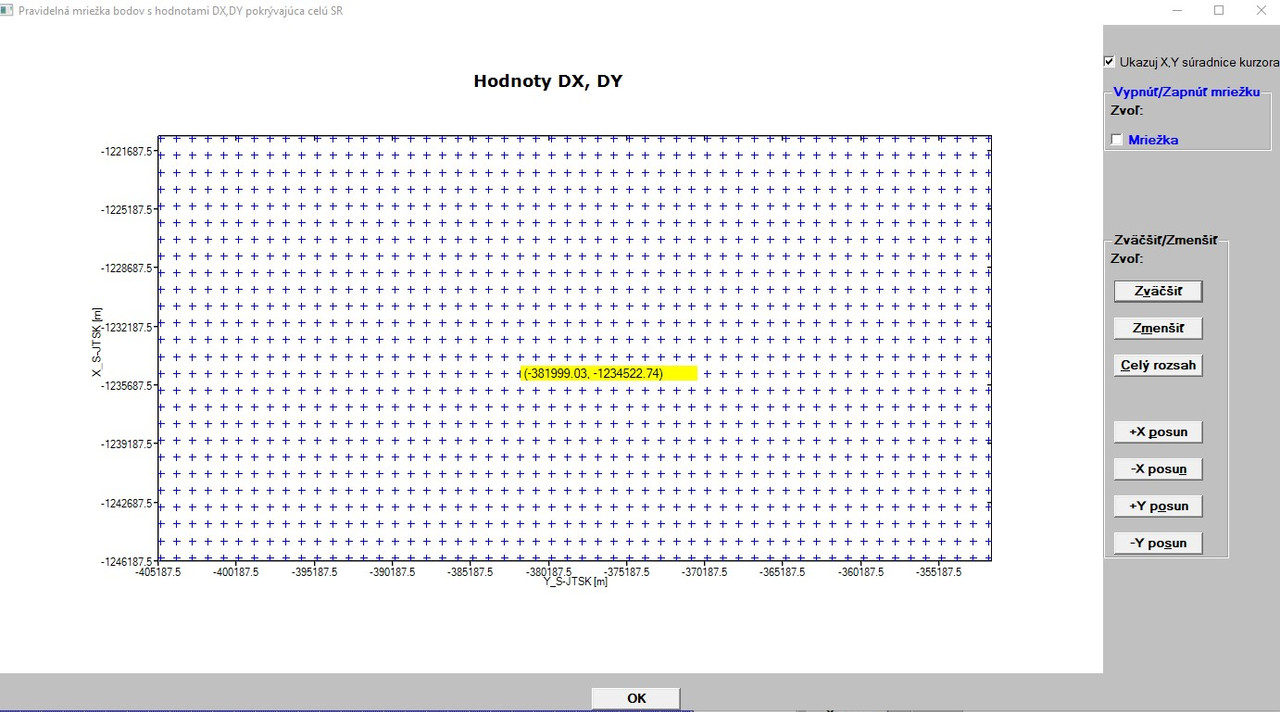
[/img]
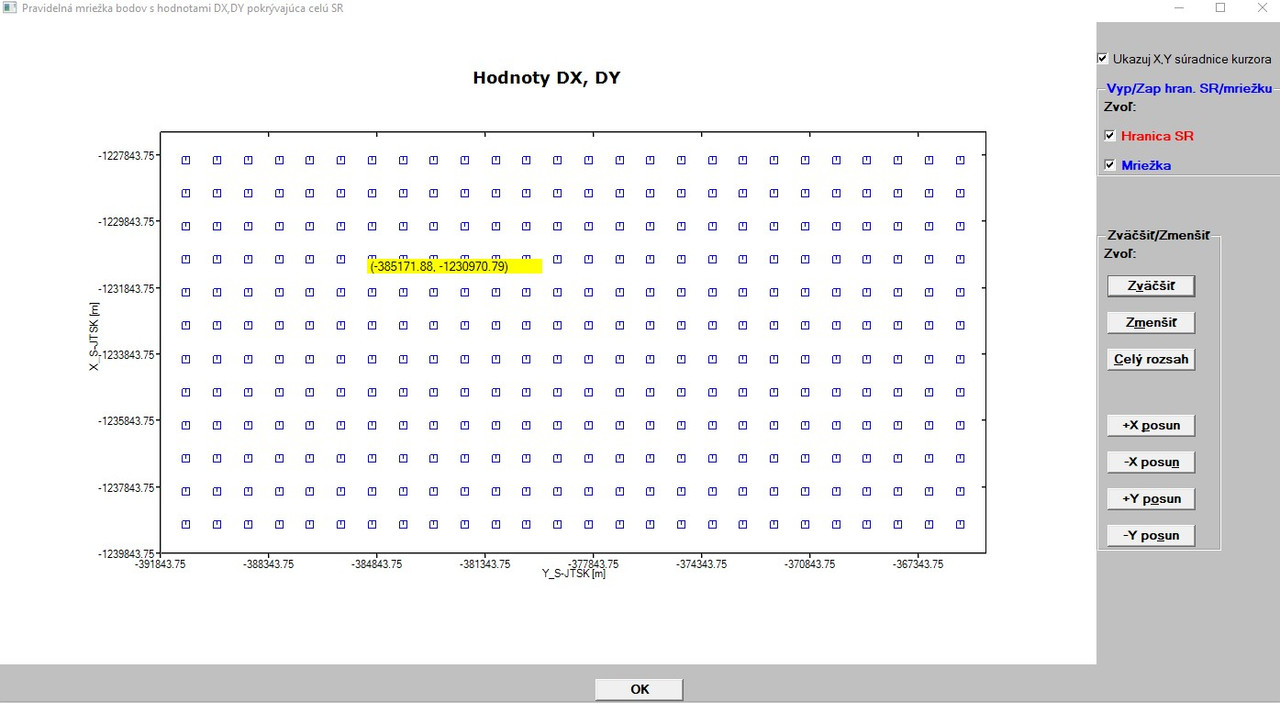
Moreover, after repeating the action 3 times or more, grid is displayed
distorted (see picture below, there are lines displayed and should be only plus signs). I suspect that the %PL code has some problem.
[url]

[/url]
Could you give me a tip what should I check in the code? |
|
| Back to top |
|
|
Kenneth_Smith
Joined: 18 May 2012
Posts: 818
Location: Lanarkshire, Scotland.
|
| Posted: Mon May 25, 2020 9:24 am Post subject: |
|
|
Martin,
A few ideas to try:
Examine the integer value returned by COPY_GRAPHICS_REGION@. It should return 1 for success.
Check that the dimensions of the %pl and the internal file you are copying to are the same, X,Y starting at 1 not zero, and the DX, DY values are the same.
Check that you are copying in the right direction to/from the graphics regions.
Try using GRAPHICS_TO_CLIPBOARD@, to check that the internal graphics file is as expected. Immediately after this call you should be able to paste the image into MS Word.
Given that the SIMPLEPLOT_REDRAW@ takes a long time to process the data, there�s always the possibility that the user clicks on another button during this time. It may be worth your while adding a control variable to each of the buttons and radio buttons, so that as soon as one is selected, at the beginning of the corresponding call back all controls are disabled, and only enabled once the current process is completed. The presence of such additional control variables can also help with guiding the sequence of statements in the %pl call back.
The flow of the control statements in the now very complex %pl call back needs to be carefully examined, since all the interactive user actions rely on this part of the code.
Do you have a reduced data set that you can use for testing purposes?
Bebugging code is always time consuming. I changed the order of some statements in some code yesterday and then later observed that one calculated variable was always displayed incorrectly, even although the value returned by print* was correct. Why using %~rf to display the value and a %fl was now being applied because of the change in position. 2 hours to track down the problem. |
|
| Back to top |
|
|
Martin_K
Joined: 09 Apr 2020
Posts: 227
|
| Posted: Mon May 25, 2020 9:48 am Post subject: |
|
|
Thanks Ken for your tips.
yesterday I also tried (among other things) just uncheck the box and did absolutely no cursor movement (the cursor was without any movement after unchecking the box, it had no influence on the behaviour of display). Now, I will realize your tips and will inform about the results. |
|
| Back to top |
|
|
Martin_K
Joined: 09 Apr 2020
Posts: 227
|
| Posted: Fri May 29, 2020 2:12 pm Post subject: |
|
|
Ken,
after a while I would like to inform you that I was able to find and remove the previous mentioned problems (namely that the graphics was always displayed regardless whether there were boxes checked or unchecked).
The problem was that the variable HANDLE_PL - at least, it seems to me so - cannot be setup to a non-zero values (like in your code above) in conjunction with the function COPY_GRAPHICS_REGION@. If so, I could do anything, the graphics was always displayed regardless the fact that the check box for one graph or both was unchecked.
However. now, I am facing another (minor) problem with %PL. ALL graphs are - by default - checked and are also correctly displayed when the function invoking them is invoked for the first time. But, as soon as I uncheck the box(es) and then check it (them) again, the graphic symbol for points (which is + sign, since SYMBOL=12) is (from an inexplicable reason for me) changed (replaced) by a small box as can be seen below:
[url]
If you would have a tip, where could be this problem hidden, I would take a look for it for a while. But this is not so important, so I will let it as is, should I spend long hours to find it. Additionally, it seems to me (as a ClearWin+ beginner) that the %PL command has some internal problem when drawing lines. When I use the option [link=lines] for the points which constitute the state border of the SR, in some areas it connects the points not in turn, but as crossed lines (zick-zack) as can be seen below:
[url]
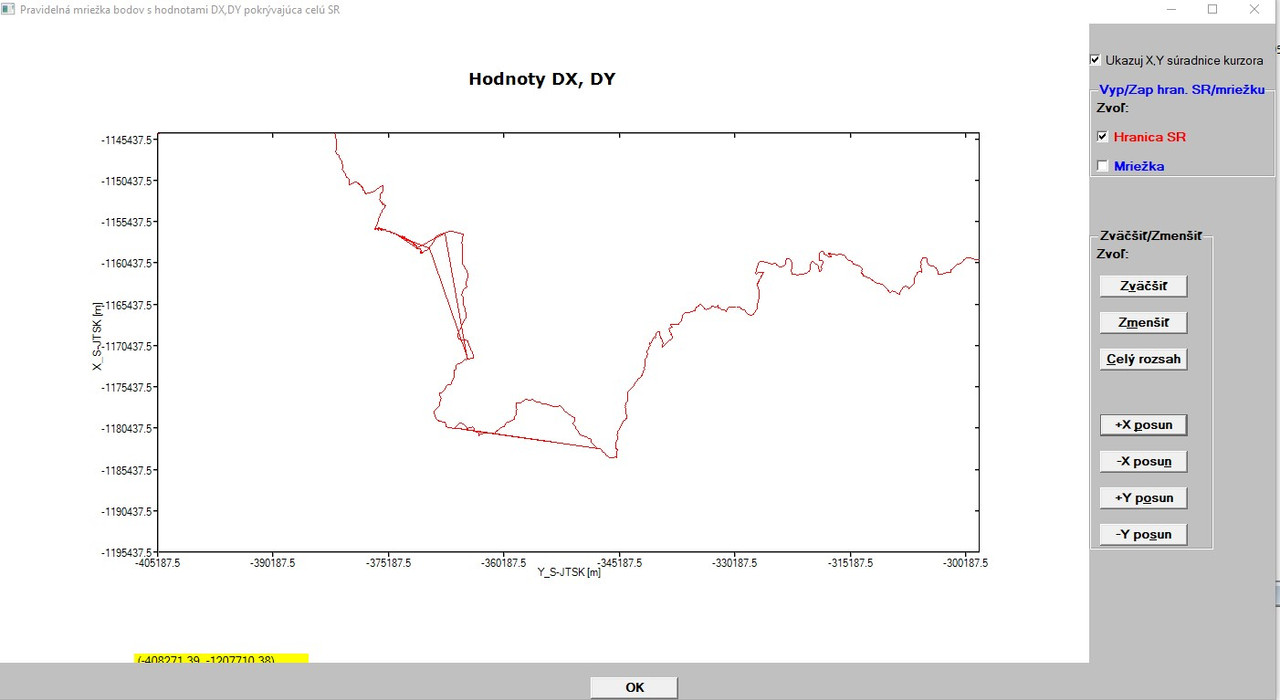
The points were created by ArcGIS (ArcMap) software, so I checked them with the software again and there is everything OK, all points are smoothly and correctly joined. I double checked with and independent software (Trimble Bussines Center, which I use for my GNSS activities) and there is also everything fine with the points (no crossed lines).
But, I will not lose time with it, since I can use the option [link=none] and then there are no lines (the border is drawn only as points).
Generally speaking, the work with the %PL command has became for me
quite hard partly due to unclear help for its options (such as full_mouse_input), partly due to its current limitations. To put it into another words: the %PL command needs to be significantly improved and there must be added clearly greater flexibility and easy of use, otherwise the way in this direction is very hard and sometimes practically unusable.
Now to my last question: I wanted to start the implementation of your code regarding the showing ellipses with DX,DY values right now, but I stopped at its very beginning. Reason? You have a parameter called N and N=11 (in both variants, I wanted to implement the second one). Later in the declaration you have (among others):
dx(1:N*N), dy(1:N*N) ... xy(1:N*N,1:N*N) ...
However, my N=87312 (grid points only)! So, N*N is a huge number and I think (when I correctly interpret your declarations), it will be not feasible with my value of parameter N (there will be huge numbers). Or something do I not understand correctly?
Thanks!
Martin |
|
| Back to top |
|
|
Kenneth_Smith
Joined: 18 May 2012
Posts: 818
Location: Lanarkshire, Scotland.
|
| Posted: Fri May 29, 2020 3:49 pm Post subject: |
|
|
Good to see you are making progress.
The combination of checkboxes and two graphics regions was not one I have used or tested before.
Yes there is a problem with symbol = 12 and symbol = 13 when used with change_plot_int@. I questioned Paul about this a few days ago. Solution until a new dll is available is not to use symbol = 12 or 13.
The solution to the big array issue is to organise the input data in a direct access file and use the record number as the index to the data. It will take a while to write the file (but you only need to do this once), and access by record number on a direct file is faster than a user can move a mouse.
locate_i_j_in_table = (i - 1 )*n + j replaces the large matrix.
Example below to demonstrate the idea based on one of my earlier posts. |
|
| Back to top |
|
|
Kenneth_Smith
Joined: 18 May 2012
Posts: 818
Location: Lanarkshire, Scotland.
|
| Posted: Fri May 29, 2020 3:50 pm Post subject: |
|
|
PART 1
| Code: | module example
use clrwin
implicit none
integer, parameter :: sp=kind(1.0), dp=kind(1.d0), gw = 1000, gh = 800, N=50
integer :: handle_internal_gr = 1, handle_pl = 2
real(kind=dp) :: dx, dy
real(kind=dp) :: x_pl2(1:2), y_pl2(1:2)
real(kind=dp),allocatable :: x_array(:), y_array(:)
integer :: rb_show_nearest_grid = 1, rb_show_adjacent_grid = 1, rb_show_grid_data = 1
contains
integer function generate_data()
integer i,j,k
allocate(x_array(1:N))
allocate(y_array(1:N))
x_array(1) = -5.d0 ; y_array(1) = -5.d0
do i = 2, N
x_array(i) = x_array(i-1) + 1.d0 ; y_array(i) = y_array(i-1) + 1.d0
end do
! open a direct access file, recl=16, so that each record can store two real* values
open(unit=10, file='integer.bn', status='UNKNOWN', access='DIRECT', recl=16, FORM='UNFORMATTED', ERR=90 )
i = 1
do while (i .le. N*N)
do j = 1, N, 1
do k = 1, N, 1
dx = random@() ; dy = random@()
write(10,REC=i,ERR=92) dx, dy
i = i + 1
end do
end do
end do
goto 100
90 STOP 'ERROR opening direct access file'
91 STOP 'ERROR closing direct access file'
92 STOP 'ERROR writing to direct access file'
93 stop 'ERROR reading from direct access file'
100 continue
x_pl2(1) = minval(x_array) ; x_pl2(2) = maxval(x_array)
y_pl2(1) = minval(y_array) ; y_pl2(2) = maxval(y_array)
generate_data = 2
end function generate_data
integer function locate_i_j_in_table(i,j,n)
integer, intent(in) :: i ! Row
integer, intent(in) :: j ! Column
integer, intent(in) :: n ! Size of n x n matrix
locate_i_j_in_table = (i - 1 )*n + j
end function locate_i_j_in_table |
|
|
| Back to top |
|
|
Kenneth_Smith
Joined: 18 May 2012
Posts: 818
Location: Lanarkshire, Scotland.
|
| Posted: Fri May 29, 2020 3:53 pm Post subject: |
|
|
Part 2
| Code: | integer function pl_cb()
character(len=30) cb_reason
integer i,j,k, x1p, y1p, jj, kk
real(kind=dp) x1r,y1r, x1rr, y1rr, dx, dy
character(len=30) output_string(4)
character(len=20), parameter :: fmt(1:2)=(/'(SP,F7.3,1A,F7.3) ','(SP,2X,A2,1X,F7.3) '/)
integer, parameter :: ngrid = 1
cb_reason = clearwin_string@('callback_reason')
if (cb_reason .eq. 'PLOT_ADJUST') i = COPY_GRAPHICS_REGION@(handle_internal_gr, 1, 1, gw, gh, handle_pl, 1, 1, gw, gh, 13369376 )
if (cb_reason .eq. 'MOUSE_MOVE' ) then
i = COPY_GRAPHICS_REGION@(handle_pl, 1, 1, gw, gh, handle_internal_gr, 1, 1, gw, gh, 13369376 )
if ( rb_show_nearest_grid .eq. 1 .or. rb_show_adjacent_grid .eq. 1 .or. rb_show_grid_data .eq. 1) then
x1p = CLEARWIN_INFO@('GRAPHICS_MOUSE_X') ; y1p = CLEARWIN_INFO@('GRAPHICS_MOUSE_Y')
i = GET_PLOT_DATA@(x1p,y1p,x1r,y1r)
write(output_string(1),fmt(1)) x1r,',',y1r
j = minloc(abs(x_array - x1r), 1) ; k = minloc(abs(y_array - y1r), 1)
write(output_string(2),fmt(1)) x_array(j),',',y_array(k)
i = GET_PLOT_POINT@(x_array(j),y_array(k),x1r,y1r) !returns real*8 not integer
x1p = nint(x1r) ; y1p = nint(y1r)
if (rb_show_nearest_grid .eq. 1) call draw_grid_point(x1p,y1p,16,rgb@(255,0,0),1)
if (rb_show_adjacent_grid .eq. 1) then
do jj = j - ngrid, j + ngrid, 1
do kk = k - ngrid, k + ngrid, 1
if (jj .lt. 1) then ; cycle
else if (kk .lt. 1) then ; cycle
else if (kk .gt. size(x_array)) then ; cycle
else if (jj .gt. size(y_array)) then ; cycle
else if (jj .eq. j .and. kk .eq. k) then ; cycle
else
i = GET_PLOT_POINT@(x_array(jj),y_array(kk),x1rr,y1rr)
call draw_grid_point(nint(x1rr),nint(y1rr),8,rgb@(0,0,200),0)
end if
end do
end do
end if
i = locate_i_j_in_table(j,k,n)
read(10,REC=i,err=93) dx, dy
goto 100
93 stop 'ERROR reading from direct access file'
100 continue
write(output_string(3),fmt(2)) 'dx',dx
write(output_string(4),fmt(2)) 'dy',dy
if (rb_show_grid_data .eq. 1) then
call draw_filled_rectangle@(x1p+10, y1p+10, x1p+150+10, y1p+20+60, rgb@(255,255,0))
call draw_rectangle@(x1p+10, y1p+10, x1p+150+10, y1p+20+60, rgb@(125,125,125))
call draw_characters@(output_string(1), x1p+10, y1p+15, rgb@(0,0,0))
call draw_characters@(output_string(2), x1p+10, y1p+30, rgb@(255,0,0))
call draw_characters@(output_string(3), x1p+10, y1p+45, rgb@(0,0,255))
call draw_characters@(output_string(4), x1p+10, y1p+60, rgb@(0,0,255))
end if
end if
end if
pl_cb = 2
end function pl_cb |
|
|
| Back to top |
|
|
Kenneth_Smith
Joined: 18 May 2012
Posts: 818
Location: Lanarkshire, Scotland.
|
| Posted: Fri May 29, 2020 3:55 pm Post subject: |
|
|
Part 3
| Code: | integer function plot()
integer, save :: iw
iw = CREATE_GRAPHICS_REGION@(handle_internal_gr,gw,gh )
if ( iw .ne. 1) STOP 'Failed to create internal graphics region'
iw = winio@('%mn[Close]&','Exit')
iw = winio@('%`bg[white]&')
call winop@('%pl[independent,x_array,link=none,symbol=12,symbol_size=1,colour=white,gridlines,frame]')
iw = winio@('%`^pl[full_mouse_input]&',gw,gh,2,x_pl2,y_pl2, handle_pl, pl_cb)
iw = winio@('%ob&')
iw = winio@('%2nl%`rb[Nearest grid]&',rb_show_nearest_grid)
iw = winio@('%2nl%`rb[Adjacent grid]&',rb_show_adjacent_grid)
iw = winio@('%2nl%`rb[Grid data]&',rb_show_grid_data)
iw = winio@('%cb&')
iw = winio@(' ')
iw = DELETE_GRAPHICS_REGION@(handle_internal_gr)
plot = 2
end function plot |
| Code: | subroutine draw_grid_point(x,y,size,colour,flag)
integer, intent(in):: x,y,size,colour,flag
integer k
call set_line_width@(2)
call draw_line_between@(x-size,y,x+size,y,colour) ; call draw_line_between@(x,y-size,x,y+size,colour)
if (flag .eq. 1) then ; k = nint(dble(size)/2.d0) ; call draw_ellipse@(x,y,k,k,colour) ; end if
end subroutine draw_grid_point
end module example
program main
use example
implicit none
integer i
i = generate_data() ; i = plot()
end program main |
|
|
| Back to top |
|
|
|
|
You cannot post new topics in this forum
You cannot reply to topics in this forum
You cannot edit your posts in this forum
You cannot delete your posts in this forum
You cannot vote in polls in this forum
|
Powered by phpBB © 2001, 2005 phpBB Group
|

