 |
forums.silverfrost.com
Welcome to the Silverfrost forums
|
| View previous topic :: View next topic |
| Author |
Message |
Martin_K
Joined: 09 Apr 2020
Posts: 227
|
 Posted: Sat May 16, 2020 2:19 pm Post subject: Posted: Sat May 16, 2020 2:19 pm Post subject: |
 |
|
Thanks Ken for your kind and valuable advises!
In the meantime I implemented (and a little bit modified) the code and formally, everything works as expected. So, final result is SUCCESS! But, I do NOT use the 2 different sets of limiting points (xmin_border, xmax_border, ymin_border, ymax_border plus xmin_grid, xmax_grid, ymin_grid, ymax_grid). It does not work as expected.
I use ONLY xmin_grid, xmax_grid, ymin_grid,ymax_grid, (and the grid step 1000m in both directions), since it covers whole country and also little beyond the SK border covering some smaller or larger parts neighbouring countries of CZ, AT, HU, UA, PL.
It means - the extent of grid points also covers all border points and all zooming functions also WORK for both graphs (country, grid) without the need to use second set of border point limits.
I tried to use the SYMBOL=12 ("+" sign), but I had to give up. I also tried to use for the border points LINK=LINES, I also had to give up. Maybe it works fine for small number of points, but for me it seems that when I have a cloud of points (I have around 135 000 points to draw), it takes very long time to response (in IT it means eternity  ). So, I use LINK=NONE and SYMBOL=0, it works very rapidly. ). So, I use LINK=NONE and SYMBOL=0, it works very rapidly.
BTW, when SYMBOL=0, what kind of symbol for points is drawn (dots)? Because I see in the graph (for grid points with SYMBOL=0) an unbroken surface
(blue in my setting, red are border points). And, when I am zooming in the grid, in no zooming in appear single dots or other graphical sign of a discrete point, always I see the blue continuous surface. Only the coordinates values on both axes change accordingly.
I will consider your ideas outlined in your latest post and I´ll let you know (maybe with additional questions). Thanks again! |
|
| Back to top |
|
 |
Kenneth_Smith
Joined: 18 May 2012
Posts: 697
Location: Hamilton, Lanarkshire, Scotland.
|
| Posted: Sat May 16, 2020 3:01 pm Post subject: |
|
|
Martin,
Post submit, I think I gave you some poor advice in the last post. Please look at the example in the following which does not require XSTEP or YSTEP, and is of a more general purpose.
The data being plotted is more akin to yours as well.
This is all very interesting as I think you are pushing %pl into new areas.
Ken |
|
| Back to top |
|
|
Kenneth_Smith
Joined: 18 May 2012
Posts: 697
Location: Hamilton, Lanarkshire, Scotland.
|
| Posted: Sat May 16, 2020 3:03 pm Post subject: |
|
|
PART 1
| Code: |
module example
implicit none
integer, parameter :: dp = kind(1.d0), n = 3000, grid_len = 200
real(kind=dp), parameter :: pi = 3.14159265359d0, dt = 1.d-4, omega = 50.d0*2.d0*pi, ta = 0.040d0
real(kind=dp) x_border(1:n), y_border(1:n), x_grid(1:grid_len*grid_len), y_grid(1:grid_len*grid_len), &
xmin_data, xmax_data, ymin_data, ymax_data !, xstep, ystep
real(kind=dp) x_min_now, x_max_now, y_min_now, y_max_now, x_centre_now, y_centre_now, x_range_now, y_range_now
contains
integer function generate_data()
integer i,j,k,k1,xx, yy
real(kind=dp) theta, dtheta
print*, 'Generating data'
theta = 0.d0
dtheta = 2.d0*pi/(real(n,kind=dp))
do i = 1, n, 1
x_border(i) = 50.d0 + 20.d0*cos(theta) ; y_border(i) = 50.d0 + 20.d0*sin(theta)
theta = theta + dtheta
print*, 'border', i, theta, x_border(i), y_border(i)
end do
xx = 0 ; yy = 0 ; k1 = 1
do i = 1, grid_len, 1
xx = 0
do j = 1, grid_len, 1
x_grid(k1) = xx ; y_grid(k1) = yy ; xx = xx + 1 ; k1 = k1 + 1
end do
yy = yy + 1
end do
print*, 'Completed generating data'
generate_data = 1
end function generate_data
integer function plot()
include<windows.ins>
integer, save :: iw
integer npoints(2)
xmin_data = min(minval(x_grid),minval(x_border)) ; print*, 'xmin_data', xmin_data
xmax_data = max(maxval(x_grid),maxval(x_border)) ; print*, 'xmax_data', xmax_data
ymin_data = min(minval(x_grid),minval(x_border)) ; print*, 'ymin_data', ymin_data
ymax_data = max(maxval(x_grid),maxval(x_border)) ; print*, 'ymax_data', ymax_data
!NEW
xmin_data = min(xmin_data,ymin_data)
ymin_data = xmin_data
xmax_data = max(xmax_data,ymax_data)
ymax_data = xmax_data
! xstep = (xmax_data - xmin_data)/10.d0 ! Dont need this now
! ystep = (ymax_data - ymin_data)/10.d0
x_min_now = xmin_data ; x_max_now = xmax_data ; y_min_now = ymin_data ; y_max_now = ymax_data
!NEW
call update_centre_and_range
npoints(1) = size(x_border)
npoints(2) = size(x_grid)
print*, 'Starting pl'
iw = winio@('%mn[EXIT]&','exit')
call winop@('%pl[native,x_array,gridlines,n_graphs=2,width=2,frame,etched,colour=blue,colour=red]')
call winop@('%pl[link=lines,link=none,symbol=0,symbol=12,smoothing=4,margin=100]')
iw = winio@('%pl[independent]&',900,900,npoints,x_border,y_border,x_grid,y_grid)
iw = winio@('%ob[scored]&')
iw = winio@('%2nl%cn%^tt[Zoom in]&', zoom_in_cb)
iw = winio@('%2nl%cn%^tt[Zoom out]&', zoom_out_cb)
iw = winio@('%2nl%cn%^tt[Full extents]%2nl&', zoom_out_full_cb)
iw = winio@('%2nl%cn%^tt[Pan pos X]&', pan_positive_x_cb)
iw = winio@('%2nl%cn%^tt[Pan neg X]&', pan_negative_x_cb)
iw = winio@('%2nl%cn%^tt[Pan pos Y]&', pan_positive_y_cb)
iw = winio@('%2nl%cn%^tt[Pan neg Y]&', pan_negative_y_cb)
iw = winio@('%cb&')
iw = winio@(' ') ; plot = 2
end function plot |
|
|
| Back to top |
|
|
Kenneth_Smith
Joined: 18 May 2012
Posts: 697
Location: Hamilton, Lanarkshire, Scotland.
|
| Posted: Sat May 16, 2020 3:04 pm Post subject: |
|
|
PART 2
| Code: |
! NEW
subroutine update_centre_and_range
x_range_now = x_max_now - x_min_now
y_range_now = y_max_now - y_min_now
x_centre_now = x_range_now*0.5d0 + x_min_now
y_centre_now = y_range_now*0.5d0 + y_min_now
end subroutine update_centre_and_range
integer function update_pl_limits()
include<windows.ins>
integer k
k = CHANGE_PLOT_DBL@(0, 'x_min', 0, x_min_now) ; k = CHANGE_PLOT_DBL@(0, 'x_max', 0, x_max_now)
k = CHANGE_PLOT_DBL@(0, 'y_min', 0, y_min_now) ; k = CHANGE_PLOT_DBL@(0, 'y_max', 0, y_max_now)
call simpleplot_redraw@()
update_pl_limits = 1
end function update_pl_limits
integer function zoom_out_cb()
include<windows.ins>
integer i
! x_min_now = x_min_now - xstep ; x_max_now = x_max_now + xstep ; y_min_now = y_min_now - ystep ; y_max_now = y_max_now + ystep
x_min_now = x_centre_now - x_range_now
x_max_now = x_centre_now + x_range_now
y_min_now = y_centre_now - y_range_now
y_max_now = y_centre_now + y_range_now
call update_centre_and_range
i = update_pl_limits() ; zoom_out_cb = 1
end function zoom_out_cb
integer function zoom_in_cb()
real(kind=dp) x_min_now_save, x_max_now_save, y_min_now_save, y_max_now_save
real(kind=dp), parameter :: limit = 1.0D-4
integer i
integer, save :: iw
x_min_now_save = x_min_now ; x_max_now_save = x_max_now ; y_min_now_save = y_min_now ; y_max_now_save = y_max_now
! x_min_now = x_min_now + xstep ; x_max_now = x_max_now - xstep ; y_min_now = y_min_now + ystep ; y_max_now = y_max_now - ystep
! NEW
x_min_now = x_centre_now - x_range_now*0.25d0
x_max_now = x_centre_now + x_range_now*0.25d0
y_min_now = y_centre_now - y_range_now*0.25d0
y_max_now = y_centre_now + y_range_now*0.25d0
print*, 'x_max_now - x_min_now', x_max_now - x_min_now
print*, 'y_max_now - y_min_now', y_max_now - y_min_now
print*
if ( ( x_max_now - x_min_now .gt. limit ) .and. ( y_max_now - y_min_now .gt. limit ) ) then
i = update_pl_limits()
else
x_min_now = x_min_now_save ; x_max_now = x_max_now_save ; y_min_now = y_min_now_save ; y_max_now = y_max_now_save
iw = winio@('%ws%2nl%cn%tt[Continue]','Max zoom level with this control.')
end if
call update_centre_and_range
zoom_in_cb = 1
end function zoom_in_cb |
|
|
| Back to top |
|
|
Kenneth_Smith
Joined: 18 May 2012
Posts: 697
Location: Hamilton, Lanarkshire, Scotland.
|
| Posted: Sat May 16, 2020 3:05 pm Post subject: |
|
|
Part 3
| Code: | integer function zoom_out_full_cb()
integer i
x_min_now = xmin_data ; y_min_now = ymin_data ; x_max_now = xmax_data ; y_max_now = ymax_data ; i = update_pl_limits()
call update_centre_and_range
zoom_out_full_cb = 1
end function zoom_out_full_cb
integer function pan_positive_x_cb()
integer i
! x_min_now = x_min_now + xstep ; x_max_now = x_max_now + xstep ; i = update_pl_limits() ; pan_positive_x_cb = 1
x_min_now = x_min_now + 0.25d0*x_range_now ; x_max_now = x_max_now + 0.25d0*x_range_now
i = update_pl_limits() ; call update_centre_and_range ; pan_positive_x_cb = 1
end function pan_positive_x_cb
integer function pan_negative_x_cb()
integer i
! x_min_now = x_min_now - xstep ; x_max_now = x_max_now - xstep ; i = update_pl_limits() ; pan_negative_x_cb = 1
x_min_now = x_min_now - 0.25d0*x_range_now ; x_max_now = x_max_now - 0.25d0*x_range_now
i = update_pl_limits() ; call update_centre_and_range ; pan_negative_x_cb = 1
end function pan_negative_x_cb
integer function pan_positive_y_cb()
integer i
! y_min_now = y_min_now + ystep ; y_max_now = y_max_now + ystep ; i = update_pl_limits() ; pan_positive_y_cb = 1
y_min_now = y_min_now + 0.25d0*y_range_now ; y_max_now = y_max_now + 0.25d0*y_range_now
i = update_pl_limits() ; call update_centre_and_range ; pan_positive_y_cb = 1
end function pan_positive_y_cb
integer function pan_negative_y_cb()
integer i
! y_min_now = y_min_now - ystep ; y_max_now = y_max_now - ystep ; i = update_pl_limits() ; pan_negative_y_cb = 1
y_min_now = y_min_now - 0.25d0*y_range_now ; y_max_now = y_max_now - 0.25d0*y_range_now
i = update_pl_limits() ; call update_centre_and_range ; pan_negative_y_cb = 1
end function pan_negative_y_cb
end module example
program main
use example
implicit none
integer i
i = generate_data() ; i = plot()
end program main |
|
|
| Back to top |
|
|
Kenneth_Smith
Joined: 18 May 2012
Posts: 697
Location: Hamilton, Lanarkshire, Scotland.
|
| Posted: Sat May 16, 2020 3:08 pm Post subject: |
|
|
In this new code, above, the zoom and pan functions operate on the coordinates at the centre and also the extents of the current display.
Enjoy
Ken |
|
| Back to top |
|
|
Martin_K
Joined: 09 Apr 2020
Posts: 227
|
| Posted: Sat May 16, 2020 4:07 pm Post subject: |
|
|
| Thanks Ken!! I will inform you how the new approach works, when I finish its implementing! |
|
| Back to top |
|
|
Martin_K
Joined: 09 Apr 2020
Posts: 227
|
| Posted: Sat May 16, 2020 11:19 pm Post subject: |
|
|
Ken - profound thanks! Now it works nearly as expected!
Important note:
I implemented the slightly modified code, however with one, but VERY SIGNIFICANT change!
There was the following part of the code:
| Code: |
x_min_data = min(x_min_data, y_min_data)
y_min_data = x_min_data
x_max_data = max(x_max_data, y_max_data)
y_max_data = x_max_data
|
When I worked also with this part - it was wrong. It caused that both axis had the same values and graphs did not work correctly when zooming in/out (to be honest, I was suspicious to this part, but I tried it. Namely, I did not understand, why there is such assignments that practically XMIN=YMIN and XMAX=YMAX. This caused UNWANTED effect that both axes had the same coordinates). So, I removed it completely - and now it works nearly as I want.
Here are some pictures:
Picture 1 (Menu selection)
[url]
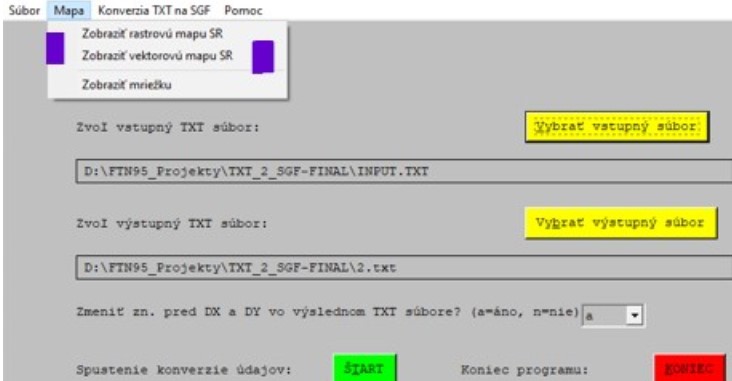
The menu option MAPA/ZOBRAZIŤ VEKTOROVÚ MAPU SR (or MAP/DISPLAY SK VECTOR MAP - between 2 violet bars) displays slovakian vector map (border lines) along with the grid points as can be seen below:
Picture 2 - basic (default) view of the state borders + grid
[url]
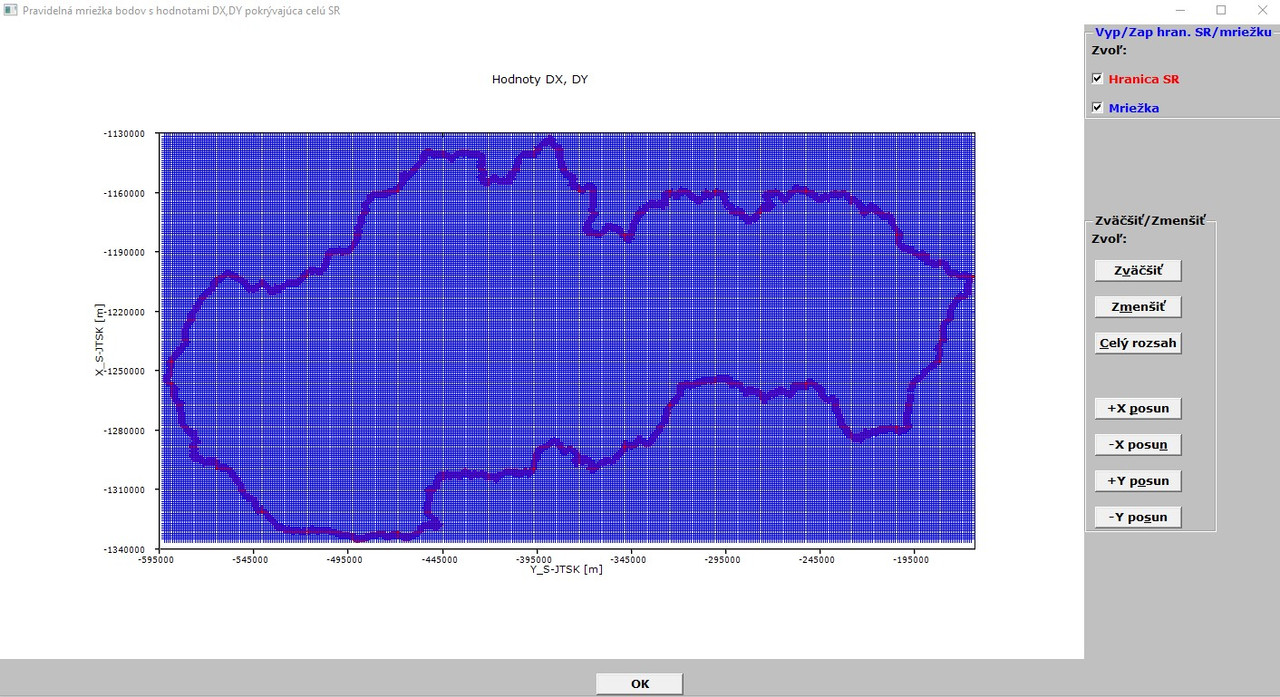
Picture 3 illustrates some pan and zoom in:
[url]
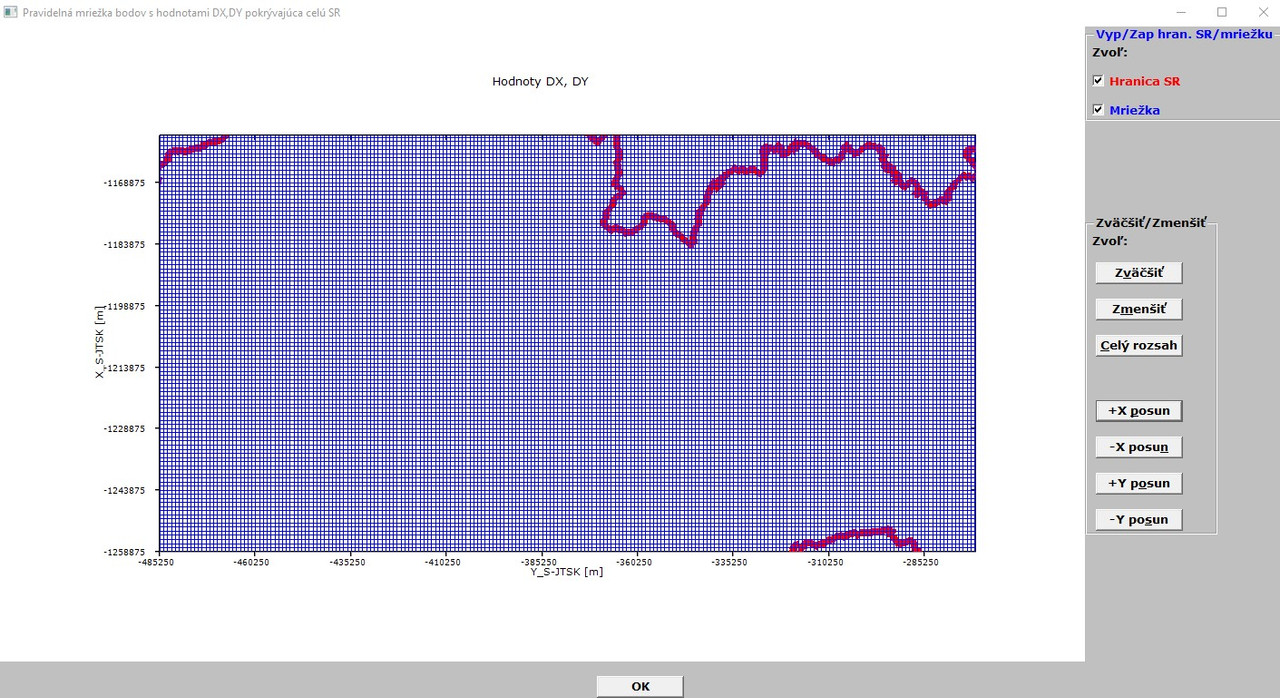
Here is still some problematic point - with the menu option MAP/DISPLAY SK VECTOR MAP (see pictures above), when I click on zoom in/out, move in X/Y directions, zoom to extents - it takes some time (around 8-12 sec) to complete the selected action and sometime the program does not respond for a while (2-3 sec). I know, with this option I have around 135000 points to draw/redraw.
Then, in the menu under MAP option is the third item called ZOBRAZIŤ MRIEKU (DISPLAY GRID ONLY).
In the picture below is the default view of the grid (87000+ points to draw/redraw):
[/url]
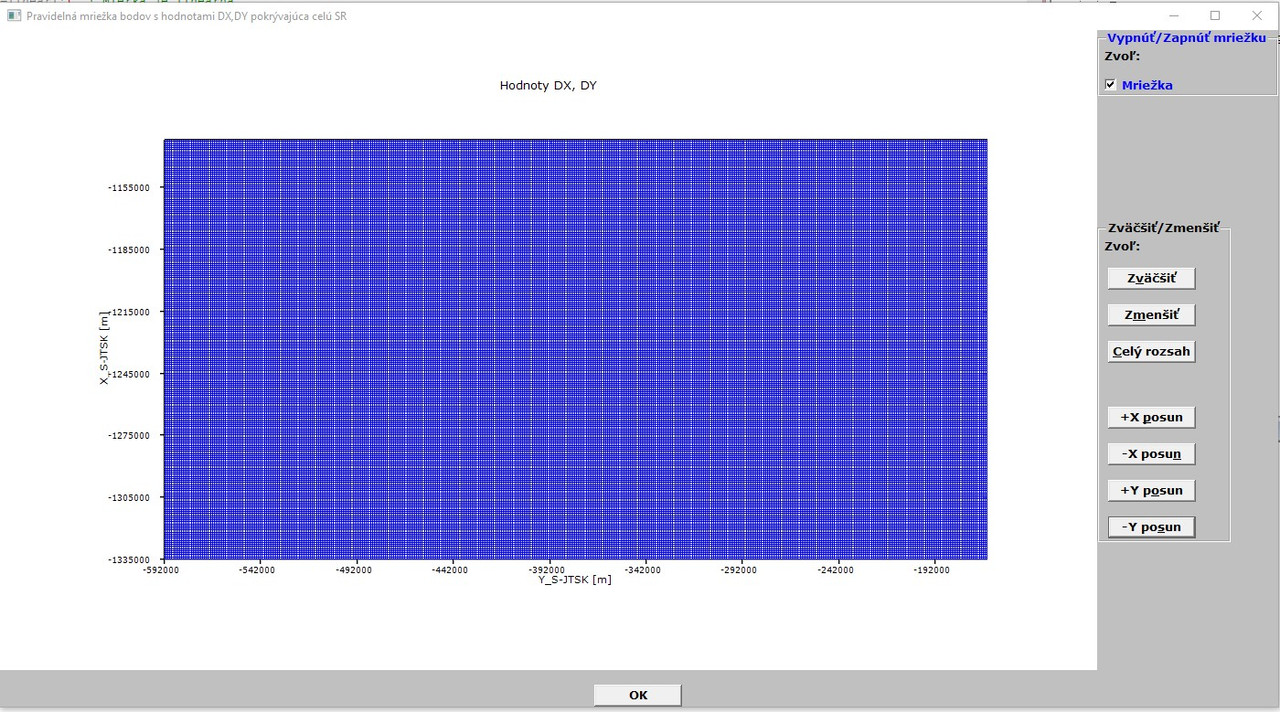
Here, the program reacts little bit quicker (87000+ points only and only rarely does not respond for about 2 sec.
Next picture demonstrates some zooming and pan of grid points only:
[url]
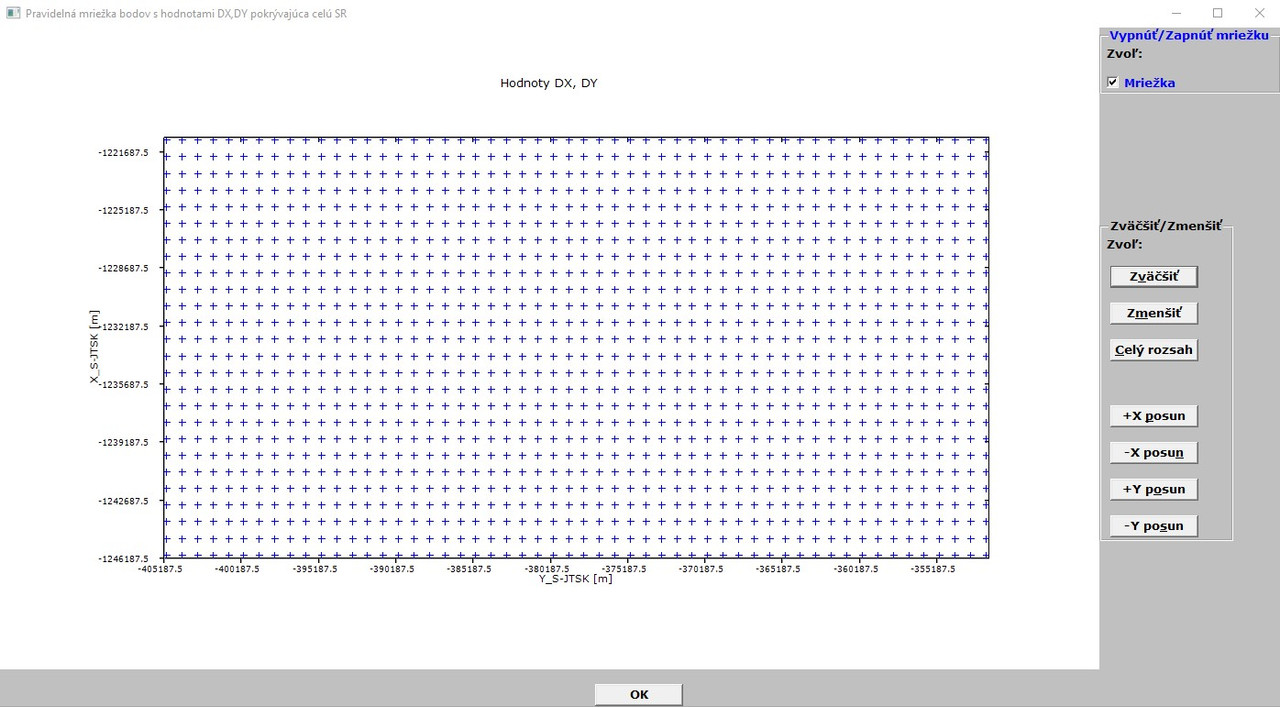
This picture is quite nice and here comes my last dream (of coarse, last dream in conjuction with this program, otherwise I have still many dreams
 ). ).
Namely, I would like to achieve such level of graphics view in the case of grid points that when I will hover with mouse cursor over a grid point, it should display in a small, bordered rectangular area its DX,DY variations.
All grid points have their DX,DY variations and both DX and DY arrays are read in by the program to its memory. Just - how to achieve this. In other softwares points have so-called attributes which can be seen with them in an information window. The DX, DY arrays (although - in reality - they are used for interpolations such as linerar, quadratic, biquadratic) could be displayed in this case as attributes of the grid nodes.
Is here (in FTN95) an attribute function which could help to realize the goal
and to assign the DX, DY variations to the corresponding grid node in a small box (similar like bubble help, %bh)?
I could let to create in a DO loop the %bh strings of DX,DY values (87000+ %bh strings), but it sounds crazy and probably unrealistic.
It could be easily assigned, since I read in all 87000+ points along with their DX, DY values.
Thanks in advance for your possible comments! |
|
| Back to top |
|
|
PaulLaidler
Site Admin
Joined: 21 Feb 2005
Posts: 7930
Location: Salford, UK
|
| Posted: Sun May 17, 2020 8:18 am Post subject: |
|
|
It may be possible to do something with %pl[full_mouse_input] together with %th[ms_style] and calls to SET_TOOLTIP_TEXT@. Note that %th can be switched on and off and has a delay that can be preset. But it looks like the routine is not documented so I will have to look into that. Here is a brief outline.
SUBROUTINE SET_TOOLTIP_TEXT@(HWND, TEXT)
INTEGER(7) HWND
CHARACTER*(*) TEXT
HWND is the Windows HANDLE of the control obtain from %lc.
p.s. SET_TOOLTIP_TEXT@ is not working as I expect it to so this post may be premature.
p.p.s. My code now works. See sample in http://forums.silverfrost.com/viewtopic.php?t=4217.
Last edited by PaulLaidler on Sun May 17, 2020 4:54 pm; edited 1 time in total |
|
| Back to top |
|
|
Kenneth_Smith
Joined: 18 May 2012
Posts: 697
Location: Hamilton, Lanarkshire, Scotland.
|
| Posted: Sun May 17, 2020 4:10 pm Post subject: |
|
|
Martin,
Good to see you are making progress. The code which confused you was for the case where the pixel length of the X and Y axis were to be the same.
One possible way forward, is outlined in the code below. Basically each time the %pl display is refreshed a copy of this is transferred to an internal graphics region. When a mouse move occurs, its coordinates are detected and written to the %pl region using the %gr graphics primitive DRAW_CHARACTERS@. This would quickly fill the screen with text, hence the reason for the stored image which is copied across back to the %pl region immediately before any text is written to the screen.
The values returned by minval and maxval in the %pl call back will already be defined elsewhere in your code.
PS Paul's suggested approach of using %th will be less memory intensive and will also look better with %th[ms_style].
Ken
Last edited by Kenneth_Smith on Sun May 17, 2020 6:13 pm; edited 1 time in total |
|
| Back to top |
|
|
Kenneth_Smith
Joined: 18 May 2012
Posts: 697
Location: Hamilton, Lanarkshire, Scotland.
|
| Posted: Sun May 17, 2020 4:11 pm Post subject: |
|
|
| Code: | module example
USE clrwin
INTEGER , PARAMETER :: N=10, gw=1000, gh=800
REAL*8 :: x(N),y(N)
integer :: handle_internal_gr = 1, handle_pl = 2, rb_control = 1
contains
integer function create_data()
integer i
DO i=1,N
x(i)=0.1d0*(i-1) ; y(i)=x(i)*x(i)
ENDDO
create_data = 2
end function create_data
integer function plot()
integer, save :: iw
iw = CREATE_GRAPHICS_REGION@(handle_internal_gr,gw,gh )
if ( iw .ne. 1) STOP 'Failed to create internal graphics region'
iw = winio@('%mn[Close]&','Exit')
iw = winio@('%`bg[white]&')
CALL winop@('%pl[width=2,y_max=0.9,framed,etched,x_array,link=curves,symbol=1,colour=red,gridlines,smoothing=4]')
iw = winio@('%`^pl[full_mouse_input]&',gw,gh,N,x,y, handle_pl, pl_cb)
iw = winio@('%`rb[Show Moose X,Y data]&',rb_control)
iw = winio@(' ')
iw = DELETE_GRAPHICS_REGION@(handle_internal_gr)
plot = 2
end function plot
integer function pl_cb()
character(len=30) cb_reason
character(len=100) output_string
integer i, x1p, y1p
real*8 x1r, y1r
integer, save :: c_yellow, c_black
logical, save :: first = .true.
if (first) then
c_yellow = rgb@(255,255,0) ; c_black = rgb@(0,0,0) ; first = .false.
end if
cb_reason = clearwin_string@('callback_reason')
if (cb_reason .eq. 'PLOT_ADJUST') then
! Other functions triggered by PLOT_ADJUST come here.
! etc.
! Now copy graphics region created by pl to internal memory
i = COPY_GRAPHICS_REGION@(handle_internal_gr, 1, 1, gw, gh, handle_pl, 1, 1, gw, gh, 13369376 )
end if
if (rb_control .eq. 1) then
if (cb_reason .eq. 'MOUSE_MOVE' ) then
x1p = CLEARWIN_INFO@('GRAPHICS_MOUSE_X') ; y1p = CLEARWIN_INFO@('GRAPHICS_MOUSE_Y')
i = GET_PLOT_DATA@(x1p,y1p,x1r,y1r)
if ( (x1r .ge. minval(x)) .and. (x1r .le. maxval(x)) .and. (y1r .ge. minval(y)) .and. (y1r .le. maxval(y)) ) then
write(output_string,'(A2,F5.3,A1,1X,F5.3,A1)') ' (',x1r,',',y1r,')'
! Recover back up graphics region from memory to screen and annotate
i = COPY_GRAPHICS_REGION@(handle_pl, 1, 1, gw, gh, handle_internal_gr, 1, 1, gw, gh, 13369376 )
call draw_filled_rectangle@(x1p, y1p, x1p+140, y1p+20, c_yellow)
call draw_characters@(output_string, x1p, y1p, c_black)
else
! Mouse moved oustide data region, so any existing annotations need to be removed.
i = COPY_GRAPHICS_REGION@(handle_pl, 1, 1, gw, gh, handle_internal_gr, 1, 1, gw, gh, 13369376 )
end if
end if
end if
pl_cb = 2
end function pl_cb
END module example
program main
use example
implicit none
integer i
i = create_data(); i = plot()
end program main |
|
|
| Back to top |
|
|
John-Silver

Joined: 30 Jul 2013
Posts: 1520
Location: Aerospace Valley
|
| Posted: Sun May 17, 2020 9:21 pm Post subject: |
|
|
Let me take the discussion sideways a little from the 'how to display the data' line, and onto the equally important ' is the data the correct data' line.
The 2 need to be taken together.
I don't think using the GET_PLOT_DATA@ function is imo not the direct solution to Martin's need.
Maybe I'm wrong, but I think what he wants is to get the EXACT PLOTTED DATA when one hovers the cursor CLOSE TO the point concerned.
The GET_PLOT_DATA gives you (I think) the data at the precise pixel where the cusor happens to be at any moment in time ?
I challenge anyone to get the cursor directly on the datapoint pixel everytime !
In any case, also remember that the pixel 'data' are not exact ! for any pixel a small range will correspondbetween it and the next pixel.
What's needed is a small algorithm to pick up the proximity of the cursor to an actual data point and then print that actual INPUT data.
If my understanding of the need is correct.
The problem then is knowing what the 'GET_PLOT_DATA actually is to test the proximity of the cursor to it.
I think that's mixed up within the internal calculations and probably at the moment isn't immediately available.
If this coulsd be incorporated into the Clearwin+ code, to produce the data when hovering around a particular point (like in Excel) then it would make an awsome addition to the program.
In a previous post some time back I wanted to get the pixel locations of the axes, tick marks, and the extent of the tick labels, to allow a precise calculation of where user-defined labelling could be placed without overlaps, and Paul introduced GET_PLOT_DATA arond that time and discussion, but while it may have its uses it also needs some fundamental data to be available.
(I can dig that post out if and when the time ariss related to this thread, but I won't immediately so as not to add unwanted noise. In any case my need then is different to Martin's here)
_________________
''Computers (HAL and MARVIN excepted) are incredibly rigid. They question nothing. Especially input data.Human beings are incredibly trusting of computers and don't check input data. Together cocking up even the simplest calculation ...  " " |
|
| Back to top |
|
|
John-Silver
Joined: 30 Jul 2013
Posts: 1520
Location: Aerospace Valley
|
| Posted: Sun May 17, 2020 9:53 pm Post subject: |
|
|
An Ad Hoc observation
On the 3rd of your graph plots above Martin (the penultimate one) there appear to be some strange (mis-)alignment of the GRID lines and the tick marks.
Maybe it's what you expect, or maybe there's a glitch either in the code, or an outside chance of some anomaly in the GRID LINEs command ?
_________________
''Computers (HAL and MARVIN excepted) are incredibly rigid. They question nothing. Especially input data.Human beings are incredibly trusting of computers and don't check input data. Together cocking up even the simplest calculation ... " |
|
| Back to top |
|
|
PaulLaidler
Site Admin
Joined: 21 Feb 2005
Posts: 7930
Location: Salford, UK
|
| Posted: Mon May 18, 2020 10:19 am Post subject: |
|
|
| I have added new options %pl[hscroll] and %pl[vscroll] for the next release. They work in the same way as similar new options for %gr and could be used in the same manner as the "pan" buttons in Ken's sample program. |
|
| Back to top |
|
|
Martin_K
Joined: 09 Apr 2020
Posts: 227
|
| Posted: Mon May 18, 2020 10:30 am Post subject: |
|
|
Many thanks, Ken, again to you for the posted code!
Thanks Paul for your alternative approach (at first glance it look simpler).
Thanks John for your comments!
Now, in turn, my comments/observations/suggestions to %PL:
1. I had a brief look today at both codes (Ken´s one and Paul´s one). To be honest, I did not catch the point and still cannot imagine how could be possible to EXACTLY match the CONCRETE DX, DY values which belongs to the CONCRETE point in the graph (when hovering over the point or clicking on the point). I have to study your approaches in detail which requires some time and I have also to do another things (not programming only).
2. Now, my spirit regarding the use of %PL begins to simulate a sinus wave (at the moment I am at the bottom). The %PL function should be simplified with crystal-clear explanation in the help/documentation what each option means and how it will be interpreted in the graph, when it is used. And - even more important, the %PL needs to be more flexible!
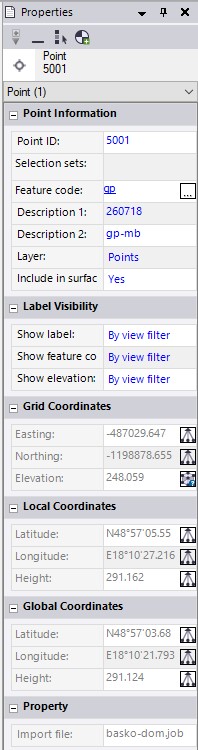
It means - it is necessary to ADD to it some additional options. In my case I would welcome an option called ATTRIBUTE or PROPERTIES for the drawn objects (points/lines), which would took the descriptive information about them automatically (if present) to the graph(s). And then, when I click on a graphical object (point/line), it should display so-called property (or attribute) window automatically (just by clicking on a graphical object).
Something similar, like in the following example (not all is required, but at least (in the case of a point object) - its real, it means GEODETICAL coordinates of the point, its number (if exists) and its description (attributes) of the point (if they exist, if not - the fields could be blank). BUT- PLEASE - NO PIXEL coordinates (this maybe could be an option, but as a surveyor, I am NOT interesting in PIXEL issues at all!!!. In case of line objects - it should display at least the length of the selected line´s segment and its description (if exists) like the name of the line.
Finally - as an example - the properties window of a point below
(it originates from a GNSS software I use, when I perform GNSS measurements). This window I get automatically when I click on a graphic object in the map. Of coarse, NOT all fields are required for the %PL.
[url]
To put it all in a one smart sentence: The %PL needs to be simplified, more robust, added with couple of new options, automatized and MUST be easy usable. Should I program pages of code to achieve such thing like to display some basic information about a selected graphical object in the graph, it loses the meaning to use it. At present, the sentence in the old ClearWin+ PDF manual which states that:
"The complexities of the Windows API are avoided by using the ClearWin+ interface with the result that Windows applications can be developed in a very small fraction of the time that otherwise would be needed."
is in conjunction with the %PL hardly imaginable. Already now, I have many lines of the code because of the use of the %PL and additional ones have to be added.
All, what I have written above, should be considered as an effort/inspiration/impulse to move the %PL function to a new level of versatility, easy of use and flexibility. |
|
| Back to top |
|
|
|
|
You cannot post new topics in this forum
You cannot reply to topics in this forum
You cannot edit your posts in this forum
You cannot delete your posts in this forum
You cannot vote in polls in this forum
|
Powered by phpBB © 2001, 2005 phpBB Group
|

