 |
forums.silverfrost.com
Welcome to the Silverfrost forums
|
| View previous topic :: View next topic |
| Author |
Message |
Martin_K
Joined: 09 Apr 2020
Posts: 227
|
 Posted: Mon May 11, 2020 1:46 pm Post subject: %PL - some issues/questions Posted: Mon May 11, 2020 1:46 pm Post subject: %PL - some issues/questions |
 |
|
Hello to anyone,
I would be thankful, if somebody could react to my following notes/questions:
1. It seems that %PL code does not work with the CALL ENABLE_UTF8@(1).
function. If you look at the title of the graph (see this picture:
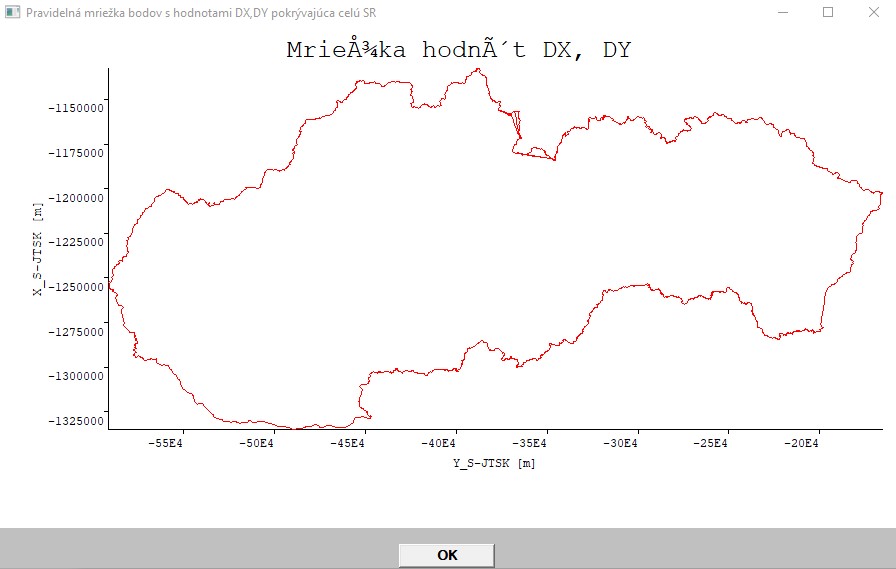
then you will see there some unreadable letters. Is it so or what�s wrong?
The %PL code is as follows:
| Code: |
i=winio@('%ww[no_border]%ca[Pravideln� mrie�ka bodov s hodnotami DX,DY pokr�vaj�ca cel� SR]%bg[grey]%pv&')
i=winio@('%bf%pl[title="Mrie�ka hodn�t DX, DY",x_axis="Y_S-JTSK [m]",y_axis="X_S-JTSK [m]",colour=red,x_array]&',900,500,N,y_hr,x_hr)
i=winio@('%ff%nl%cn%tt[OK]&')
i=winio@('%2nl ')
|
2. I wanted to see the X,Y axes with texts in bold, so I used %BF%PL, but it seems it has no effect as can be seen on the picture above. Am I right?
Should I understand the %PL command works in such way that it ignores any other %codes and if not, where should they be put in conjunction with %PL to see their own effect (like bold letters in X,Y axis)?
3. How could I tell the %PL command that I want to have displayed the
Y values on horizontal axis (Y_S-JTSK) in normal (NOT scientific) format, it means as -550000, -500000, -450000, ... etc, NOT as -55E4, -50E4,...
exactly as it is on the vertical axis? The format for displaying of values on both axis was automatically managed by %PL (I specified nothing).
4. I want to draw the whole grid of nodes with X,Y coordinates on the same picture (to overlay it). The NORTH-SOUTH direction ranges about 204km and in EAST-WEST direction about 430km. The step (distance between nodes) in both directions is 1km. How to define a suitable
scale for it to have displayed the whole grid (nodes of the grid) overlaying properly the picture above (in fact, it represents the state borders of Slovakia)?
5. When I will have a success with drawing of the whole grid (each node will be represented by a dot or cross or something similar) over the map of Slovakia, I would like to achieve such thing that when I will hover with mouse over a node, it should display in a small bordered rectangle its DX, DY values (every node of the grid has its own specific DX,DY variations). Is it even achievable and if yes, could you get me a tip how to do it?
Many thanks in advance!
Martin |
|
| Back to top |
|
 |
PaulLaidler
Site Admin
Joined: 21 Feb 2005
Posts: 8217
Location: Salford, UK
|
| Posted: Mon May 11, 2020 3:02 pm Post subject: |
|
|
1. %pl has not been tested with UTF-8 code and there are a couple of things that would need to be fixed for this to work.
2. %bf and %it should work when placed before %pl. %it is easier to see.
The following code illustrates how to set a different font for the title.
| Code: | i=winio@('%fn[Verdana]%ts[1.2]%it%gf%sf&',hTitleFont)
CALL winop_hdl@("%pl[title_hfont]",hTitleFont)
|
I will need more time to think about your other questions. |
|
| Back to top |
|
|
Kenneth_Smith
Joined: 18 May 2012
Posts: 818
Location: Lanarkshire, Scotland.
|
| Posted: Mon May 11, 2020 3:17 pm Post subject: |
|
|
Martin,
Lots of equations!
Firstly you can attach a call back function to the %pl, which is a called when the plot is updated or there is a mouse movement/click in the %pl region. The reason why the call back has been called can be identified by a call to CLEARWIN_STRING@. Depending on the value returned, the call back can perform different actions.
The call back will also be called then the %pl region is initially drawn, or the data in the %pl region updated. In this case CLEARWIN_STRING@ will return �PLOT_ADJUST�. This could for example us used to position an image above the plot as a title. This is exactly the same as importing an image into a %gr region. In a similar way mouse movements and clicks can be detected, so that gives you a way to interrogate the x/y data in the plot.
You also need to look at the use of CLEARWIN_INFO@. Once CLEARWIN@STRING@ has detected a mouse movement or click in the graphics region, CLEARWIN_INFO@ will give you the coordinates of the event (using GRAPHICS_MOUSE_X and GRAPHICS_MOUSE_Y).
The following routine can be called from within a %PL callback function in order to get the pixel coordinates of a particular point relative to the axes.
INTEGER FUNCTION GET_PLOT_POINT@(x,y,xpix,ypix)
There is also the inverse function GET_PLOT_DATA@. This is for use with [full_mouse_input] and gets the (x,y) values for a given point on the screen. The point is retrieved by calling clearwin_info@ using "GRAPHICS_MOUSE_X" and "GRAPHICS_MOUSE_Y".
INTEGER FUNCTION GET_PLOT_DATA@(ix,iy,x,y)
By using these functions, in the call back you should be able to draw a grid over the map by appropriate calls to DRAW_LINE_BETWEEN@. All of the basic graphics primitives can be used to draw to the %pl region, once you have worked out the coordinates using the functions above.
Depending on what you are trying to do, the %pl call back can become rather complex. In response to CLEARWIN_STRING@ PLOT_ADJUST you can annotate the %pl region. The user can interact with the %pl region via mouse moves and clicks.
Ken |
|
| Back to top |
|
|
LitusSaxonicum
Joined: 23 Aug 2005
Posts: 2403
Location: Yateley, Hants, UK
|
| Posted: Mon May 11, 2020 3:30 pm Post subject: |
|
|
Martin,
I think that you would be better off if you did this task in a %gr window. I suggest that you fill the window with a particular colour, say light grey, then draw the country outline as a filled polygon, then use a different colour (say white) as the fill colour. That will give you a nice look. If you have a graphics callback function, and FULL_MOUSE_INPUT then you can get the pixel coordinates of the mouse on a regular basis.
In order to plot your country outline you will need to have a scale and two coordinates. I usually use the real world coordinates of the centre of the object and the middle of the %gr so that the object is centred. From your pixel coordinates you can back-calculate the real world coordinates of your mouse pointer. Don't forget to allow for half the pixel width and height, and round the result or you will get a deceptive list of decimal places in the coordinates.
The easiest way to display those coordinates is in the status bar with 2 boxes. If you want to display the coordinates in the vicinity of the mouse pointer, then you have to select XOR mode, then draw the box and the coordinates. Before you change the coordinates, redraw the box and text, as XOR mode will make them disappear. This is much harder than putting them in the status bar, as the status bar takes care of removing the contents each time! XOR is set with SUBROUTINE GRAPHICS_WRITE_MODE@.
Periodically I would redraw the map just to take care of any pixels that got set and not unset for any reason.
In a %gr window you have a much better control of fonts and text.
Eddie |
|
| Back to top |
|
|
Kenneth_Smith
Joined: 18 May 2012
Posts: 818
Location: Lanarkshire, Scotland.
|
| Posted: Mon May 11, 2020 4:22 pm Post subject: |
|
|
Martin,
Eddie is probably correct if you want full control of everything use %gr rather than %pl.
Below is some of the ideas I was trying to explain. Equally applicable to %gr with a callback function.
| Code: | module example
implicit none
integer, parameter :: dp = kind(1.d0), n = 100
real(kind=dp) x(1:n), y(1:n)
contains
integer function generate_data()
integer i
do i = 1, n, 1
x(i) = dble(i) ; y(i) = x(i)*x(i)
end do
generate_data = 1
end function generate_data
integer function plot()
include<windows.ins>
integer, save :: iw
call winop@('%pl[native,x_array,gridlines]')
iw = winio@('%^pl[full_mouse_input]&',600,500,N,x,y, pl_cb)
iw = winio@('%ff%2nl%cn%tt[Close]&')
iw = winio@(' ')
plot = 1
end function plot
integer function pl_cb()
include<windows.ins>
character(len=30) cb_reason
integer x,y
cb_reason = clearwin_string@('callback_reason')
if (cb_reason .eq. 'PLOT_ADJUST') then
print*, 'Plot adjust - draw red box around graph.'
print*
call set_line_width@(2)
call draw_rectangle@(5,5,600-5,500-5,rgb@(255,0,0))
end if
if (cb_reason .eq. 'MOUSE_MOVE') then
print*, 'Mouse_move in object at', CLEARWIN_INFO@('ACTION_X'), CLEARWIN_INFO@('ACTION_Y')
print*, 'Mouse move in local coordinates at', CLEARWIN_INFO@('GRAPHICS_MOUSE_X'),CLEARWIN_INFO@('GRAPHICS_MOUSE_Y')
print*
end if
if (cb_reason .eq. 'MOUSE_LEFT_CLICK') then
print*, 'Mouse_left_click in object at', CLEARWIN_INFO@('ACTION_X'), CLEARWIN_INFO@('ACTION_Y')
print*, 'Mouse_left_click in local coordinates at', CLEARWIN_INFO@('GRAPHICS_MOUSE_X'),CLEARWIN_INFO@('GRAPHICS_MOUSE_Y')
print*
end if
pl_cb = 1
end function pl_cb
end module example
program main
use example
implicit none
integer i
i = generate_data() ; i = plot()
end program main |
|
|
| Back to top |
|
|
PaulLaidler
Site Admin
Joined: 21 Feb 2005
Posts: 8217
Location: Salford, UK
|
| Posted: Mon May 11, 2020 4:39 pm Post subject: |
|
|
In the following sample program the title is OK in UTF-8 form so I don't know why it is not working for you.
| Code: | integer function iprint()
c_external print_graphics@ '__print_graphics' (val):integer*4
integer ir
integer(7) hwnd
common hwnd
ir = print_graphics@(0.0)
iprint = 2
end function
WINAPP
INCLUDE <windows.ins>
INTEGER N,i
integer,external::cb,iprint
PARAMETER(N=10)
REAL*8 x(N),y(N)
DO i=1,N
x(i)=0.1d0*(i-1)
y(i)=x(i)*x(i)-1.0d0
ENDDO
CALL ENABLE_UTF8@(1)
i=winio@("%ww%ca[Quadratic]%pv&")
CALL winop@('%pl[title="Otvoriť s�bor"]') !graph title
CALL winop@("%pl[width=2]") !pen width
CALL winop@("%pl[x_array]") !x data is provided as an array
CALL winop@("%pl[link=curves]") !join data points with curves
CALL winop@("%pl[symbol=9]") !mark data points with filled rhombuses
CALL winop@("%pl[colour=red]") !pen colour
CALL winop@("%pl[pen_style=2]") !2=PS_DOT
CALL winop@("%pl[tick_len=6]")
CALL winop@("%pl[frame,gridlines]")
CALL winop@("%pl[y_sigfigs=2]")
CALL winop@("%pl[y_axis=y-data]")
i=winio@('%^pl&',400,250,N,x,y,cb)
i=winio@('%sf%ff%nl%cn%^tt[Print]',iprint)
END
integer function cb()
use clrwin
real*8 xpix,ypix
i=get_plot_point@(0.5d0,0.25d0,xpix,ypix)
!call draw_line_betweenD@(xpix,ypix,xpix,ypix-20.0d0,0)
cb = 2
end
|
|
|
| Back to top |
|
|
Martin_K
Joined: 09 Apr 2020
Posts: 227
|
| Posted: Mon May 11, 2020 11:27 pm Post subject: |
|
|
Thanks guys for your ideas! I have to study them, which costs time and
- as obvious - I have not so much time.
But, I must clarify a thing to assure that we talk about the same thing.
First, thanks Paul for your code. On first look - the difference between my program and the code you posted is that I use USE MSWIN, whereas you have INCLUDE <windows.ins>. Could it be a problem?
Paul, could you post (if you have) a sample code how could I draw two plots on the same axis?
I tried it according to on-line help, it does not work with me. But, in on-line help is not exactly the same situation demonstrated as I have.
I have the following:
1st graph (the picture I already posted in this communications - state border of SK) is created of 47000+ pairs of points with X,Y planar geodetical coordinates and has the following code:
| Code: |
i=winio@('%bf%pl[title="Hodnoty DX, DY",x_axis="Y_S-JTSK [m]",y_axis="X_S-JTSK [m]",N_GRAPHS=1,colour=red,x_array]&',900,500,N,y_hr,x_hr)
|
So, N represents here the number of 47000+ points.
2nd graph, which I would like to create on the same axis as in the 1st case,
(in fact - overlay it) will have 87 000+ pairs of points with X,Y coordinates and their DX,DY variations (I can neglect the DX,DY variations for now).
In the on-line help is the following example:
--------------------
Here is a fragment of code that shows how to plot two graphs on one set of axes.
| Code: |
i=winio@('%pl[X_AXIS=Time(Miliseconds),Y_AXIS=Amplitude,'//
+ 'TITLE="Sample",N_GRAPHS=2,COLOUR=red,COLOUR=blue,X_ARRAY]',
+ 300,300,N,xarr,yarr1,yarr2)
|
There is one x-array for the two y-arrays. The first graph would be red in colour and the second blue.
---------------------
So, in contrast to the on-line example I have TWO X-arrays and TWO Y-arrays (47000+ X,Y point pairs and 87000+ X,Y point pairs). I do not know how to achieve to draw both cases on one graph.
CLARIFICATION:
First array of X,Y values (47000+ X,Y coordinates) represents state border.
Second array of X,Y values (87000+ X,Y coordinates) represents the grid of nodes with DX, DY variations for each node and they form a rectangle shape
needed for further interpolations.
Here is an excerpt how the grid nodes look in the file, which is read in by
the program :
-1335000,-492000, 0.96, 0.84
-1335000,-491000, 0.97, 0.83
-1335000,-490000, 0.97, 0.82
-1335000,-489000, 0.98, 0.81
-1335000,-488000, 0.98, 0.80
So, my basic goal is to have both sets of coordinates displayed in one (the same) graph with the same axis and with possibility to zoom out/in the points.
Top goal would be to pick a node in the graph and there would be displayed
its DX,DY values when hovering over the node with mouse cursor (something like bubble help).
But first, I need to unify both sets of data to be displayed in one graph with
one set of X,Y axis. |
|
| Back to top |
|
|
PaulLaidler
Site Admin
Joined: 21 Feb 2005
Posts: 8217
Location: Salford, UK
|
| Posted: Tue May 12, 2020 7:48 am Post subject: |
|
|
It makes no difference whether you use "use clrwin" or "include <clearwin.ins>".
Here is some sample code. I think that it originated with DanRRight.
| Code: | WINAPP
MODULE modd
USE mswin
INTEGER,PARAMETER::N=10
REAL*8 X(N),Y(N),Z(N),T(N)
!.....................................
CONTAINS
!.....................................
INTEGER FUNCTION callb()
REAL(2) random
DO i=1,N
X(i)=i
Y(i)=exp(1.*i) * random()
Z(i)=exp(2.*i) * random()
T(i)=exp(3.*i) * random()
ENDDO
CALL simpleplot_redraw@
callb = 2
END FUNCTION
END MODULE
!.....................................
PROGRAM hhh
USE clrwin
USE modd
j=callb()
i=winio@('%ww&')
CALL winop@("%pl[native]")
CALL winop@("%pl[x_array]")
CALL winop@("%pl[scale=log_linear]")
CALL winop@("%pl[y_min=1.0]")
CALL winop@("%pl[symbol_size=4]")
CALL winop@("%pl[symbol_size=8]")
CALL winop@("%pl[symbol_size=12]")
CALL winop@("%pl[y_max=1e13]")
CALL winop@("%pl[colour=red,symbol=7]")
CALL winop@("%pl[colour=blue,symbol=8]")
CALL winop@("%pl[colour=green,symbol=9]")
i=winio@('%pl&', 600,400, N, X,Y,Z,T)
i=winio@('%ac[Ctrl+Z]&',callb)
i=winio@('%ff%cn%^bt[Redraw]%es',callb)
END |
|
|
| Back to top |
|
|
Kenneth_Smith
Joined: 18 May 2012
Posts: 818
Location: Lanarkshire, Scotland.
|
| Posted: Tue May 12, 2020 12:19 pm Post subject: |
|
|
Martin, when you have multiple x arrays you need to use the %pl[independent] option.
Example below.
| Code: |
module example
implicit none
integer, parameter :: dp = kind(1.d0), n = 1000
real(kind=dp), parameter :: pi = 3.14159265359d0
real(kind=dp), parameter :: dt = 1.d-4, omega = 50.d0*2.d0*pi, ta = 0.040d0
real(kind=dp) t1(1:n), ac(1:n), t2(1:n), dc(1:n), t3(1:n), inst(1:n)
integer :: npoints(1:3) = n, control(1:3) = 1
contains
integer function generate_data()
integer i
do i = 1, n, 1
if (i .gt. 1) then
t1(i) = t1(i-1) + dt
else
t1(i) = 0.d0
end if
ac(i) = sqrt(2.d0) * cos(omega * t1(i) - pi )
dc(i) = -ac(1) * exp(-t1(i)/ta)
inst(i) = ac(i) + dc(i)
end do
t2 = t1
t2 = t1
generate_data = 1
end function generate_data
integer function plot()
include<windows.ins>
integer, save :: iw
call winop@('%pl[native,x_array,independent,gridlines,n_graphs=3,width=2,frame,etched]')
call winop@('%pl[colour=blue,colour=red,colour=black]')
iw = winio@('%pl&',600,500,npoints,t1,ac,t2,dc,t2,inst)
iw = winio@('%ob[scored]&')
iw = winio@('%ws&','Select ')
iw = winio@('%2nl%tc[blue]%`^rb[ac]&', control(1),update_cb)
iw = winio@('%2nl%tc[red]%`^rb[dc]&', control(2),update_cb)
iw = winio@('%2nl%tc[black]%`^rb[inst]&',control(3),update_cb)
iw = winio@('%cb&')
iw = winio@('%ff%2nl%cn%tt[Close]&')
iw = winio@(' ')
plot = 1
end function plot
integer function update_cb()
include<windows.ins>
integer i, k
do i = 1, 3
if (control(i) .eq. 0) then
k = CHANGE_PLOT_INT@(0, 'link', i, 0) ! No lines
else
k = CHANGE_PLOT_INT@(0, 'link', i, 1) ! Draw lines
end if
end do
call simpleplot_redraw@()
update_cb = 1
end function update_cb
end module example
program main
use example
implicit none
integer i
i = generate_data() ; i = plot()
end program main
|
Note that npoints is now an array, containing the number of data points in each graph. In this example x1 array is t1, x2 is t2, and x3 is t3.
The example also shows how to turn graphs on and off using the check boxes to the right of the %pl region.
Ken |
|
| Back to top |
|
|
Martin_K
Joined: 09 Apr 2020
Posts: 227
|
| Posted: Tue May 12, 2020 12:59 pm Post subject: |
|
|
Many thanks Paul!
Since I have two different variables N (47000 and 87000), I have to modify
the code of DanRRight which assumes the same N for all 4 arrays (X,Y,Z,T).
I just wanted to ask something for %PL options STACKED and INDEPENDENT
but I see that meanwhile Ken posted something, so I will study his response first!
By the way, is there some answer to my question 3 (how to tell the %PL, not to use scientific format for horizontal axis, just normal format)? |
|
| Back to top |
|
|
Martin_K
Joined: 09 Apr 2020
Posts: 227
|
| Posted: Tue May 12, 2020 3:33 pm Post subject: |
|
|
Ken - many thanks, SUCCESS!
So, the keyword of %PL option for this was INDEPENDENT and - of coarse,
corresponding arrangement for variable N (npoints) as an array (NOT single scalar) of several graphs (in my case - 2 graphs with different number of points drawn on the same X,Y axes)!
Since I use (as a geodesist) a grid for the second (overlaying) graph with dimensions of 204x428 km (step is 1km in both directions, N-S, E-W) which constitutes 87312 point pairs (nodes) with their real world geodetical planar coordinates in slovakian unified cadastral network (abbreviation in SK: S-JTSK), I see there (on the graph) no distances between points (they are drawn so dense).
So I have to do something with ZOOM IN/OUT functionality.
Do you think that %SL would be good way to have some (modest) zooming
functionality? |
|
| Back to top |
|
|
PaulLaidler
Site Admin
Joined: 21 Feb 2005
Posts: 8217
Location: Salford, UK
|
| Posted: Tue May 12, 2020 4:04 pm Post subject: |
|
|
Martin
Can you post a very short working program that shows only the format that you want to change. I can see -55E4 etc. in your image but I don't recall how to reproduce it. It only needs a few lines. I am not interested in the graph or anything else. |
|
| Back to top |
|
|
Martin_K
Joined: 09 Apr 2020
Posts: 227
|
| Posted: Tue May 12, 2020 5:44 pm Post subject: |
|
|
Paul,
I ma not sure whether this will satisfy your requirement, since whole this part of code stems from my subroutine which performs the reading in two files (one containing the state border coordinates and the other one containing the grid coordinates) and then draws the plot (by the way - now, after implementing Ken�s philosophy to produce more graphs than one on the same axes, the %PL uses for both directions so-called scientific format).
Here is the part of the code for drawing:
| Code: |
SUBROUTINE MAPA ()
USE MSWIN
IMPLICIT NONE
EXTERNAL kon1
INTEGER*4 n, neexistuje, i_error, kon1, w, h, ans, i, ioerr, pr_subor4, m, npoints (1:2)
PARAMETER(N=47041)
REAL*8 x_hr(N),y_hr(N)
REAL*8, ALLOCATABLE X(:),Y(:),DX(:),DY(:)
CHARACTER*80 riadok
CHARACTER*129 subor4
SAVE
COMMON/retazec2/subor4
call ENABLE_UTF8@(1)
npoints(1) = N
neexistuje = 0
i_error = 0
open (9, file="SR_hranice_body.txt", access='sequential',status="old",position='rewind',err=1)
.......
........
........
i=winio@('%ww[no_border]%ca[Pravideln� mrie�ka bodov s hodnotami DX,DY pokr�vaj�ca cel� SR]%bg[grey]%pv&')
CALL winop@('%pl[native]')
CALL winop@('%pl[scale=linear]')
CALL winop@('%pl[title="Hodnoty DX, DY"]')
CALL winop@('%pl[x_axis="Y_S-JTSK [m]"]')
CALL winop@('%pl[y_axis="X_S-JTSK [m]"]')
CALL winop@('%pl[x_array]')
CALL winop@('%pl[independent]')
CALL winop@('%pl[colour=red,colour=blue,n_graphs=2,frame,etched]')
i=winio@('%pl&',900,500,npoints,y_hr,x_hr,y,x)
i=winio@('%ff%nl%cn%tt[OK]&')
|
If necessary, I can send whole source code of the subroutine to you. |
|
| Back to top |
|
|
PaulLaidler
Site Admin
Joined: 21 Feb 2005
Posts: 8217
Location: Salford, UK
|
| Posted: Wed May 13, 2020 1:17 pm Post subject: |
|
|
Martin
I have reduced your sample to the following test program but it needs data for me to be able to see the exponent form that is not wanted. Can you supply some simple data for this purpose?
My guess is that the form is automatically generated at the moment but I might be able to add an option that allows the alternative form if there is space to display it.
| Code: | winapp
program main
use clrwin
integer n, i, npoints(2)
parameter(N=47041)
real*8 x_hr(N),y_hr(N)
real*8 x(N),y(N)
call enable_utf8@(1)
npoints = N
y_hr = 0.0d0
x_hr = 0.0d0
y = 0.0d0
x = 0.0d0
CALL winop@('%pl[native]')
CALL winop@('%pl[scale=linear]')
CALL winop@('%pl[title="Hodnoty DX, DY"]')
CALL winop@('%pl[x_axis="Y_S-JTSK [m]"]')
CALL winop@('%pl[y_axis="X_S-JTSK [m]"]')
CALL winop@('%pl[x_array]')
CALL winop@('%pl[independent]')
CALL winop@('%pl[colour=red,colour=blue,n_graphs=2,frame,etched]')
i=winio@('%pl&',900,500,npoints,y_hr,x_hr,y,x)
i=winio@('%ff%nl%cn%tt[OK]')
end |
|
|
| Back to top |
|
|
Martin_K
Joined: 09 Apr 2020
Posts: 227
|
| Posted: Wed May 13, 2020 1:30 pm Post subject: |
|
|
Paul,
I can - of coarse - provide you both data sets in full extent if you want
(remember: one file contains 47041 lines of point pairs with X,Y coordinates and the second one contains 87312 lines of point pairs with X,Y,DX,DY values).
I can send you both via email.
Or should I paste here some 20 lines or so of both files? Would it be sufficient? Let me know! |
|
| Back to top |
|
|
|
|
You cannot post new topics in this forum
You cannot reply to topics in this forum
You cannot edit your posts in this forum
You cannot delete your posts in this forum
You cannot vote in polls in this forum
|
Powered by phpBB © 2001, 2005 phpBB Group
|

