 |
forums.silverfrost.com
Welcome to the Silverfrost forums
|
| View previous topic :: View next topic |
| Author |
Message |
DanRRight
Joined: 10 Mar 2008
Posts: 2815
Location: South Pole, Antarctica
|
 Posted: Sun Apr 15, 2018 11:38 am Post subject: Posted: Sun Apr 15, 2018 11:38 am Post subject: |
 |
|
Paul,
I checked 8.30 with DLL23
Looks like for linear scale plots the placing of numbers on axis were fixed so that plot has now reasonable amount of numbers per axis and the numbers itself are not looking "bad".
The next would be great to fix bugs in LOG scale which are long overdue. The %pl then will be very useful tool. The examples of the bugs are described and pictured in detail in my last post on page 4 of this thread.
One more thing: a bug was introduced with the framed plot, you can see here that the thickness of the line of the frame is not the same:
| Code: | use clrwin
parameter (N=5)
real*8 X(N), Y(N)
Data X/1e1, 1e2, 1e3, 1e4, 1e5/
Data Y/2.2, 66, 8333, 1111, 777/
i=winio@('%sf%ts%bf%es&', 2d0)
call winop@("%pl[axes_pen=3,width=3,x_axis='X Axis Title',y_axis='Y Axis Title']")
i=winio@('%ww%pv%pl[native,framed,x_array,scale=log_log,N_GRAPHS=1]', 625,500, n, X, Y)
end |
|
|
| Back to top |
|
 |
PaulLaidler
Site Admin
Joined: 21 Feb 2005
Posts: 7924
Location: Salford, UK
|
| Posted: Mon Apr 16, 2018 12:58 pm Post subject: |
|
|
The option [frame_pen=dval] now provides the line width of the frame where dval is the width.
If you can post or send me the code for the bug then I will aim to look into it when time permits. |
|
| Back to top |
|
|
DanRRight
Joined: 10 Mar 2008
Posts: 2815
Location: South Pole, Antarctica
|
| Posted: Mon Apr 16, 2018 1:45 pm Post subject: |
|
|
Thanks for new option. As to the codes they are here, cited from page 4 above
| DanRRight wrote: |
1) | Code: | use clrwin
parameter (N=5)
real*8 X(N), Y(N)
Data X/1e1, 1e2, 1e3, 1e4, 1e5/
Data Y/2.2, 66, 8333, 1111, 777/
i=winio@('%ww%pv%pl[framed,x_array,scale=log_log,N_GRAPHS=1]%es', 625,500, N, X, Y)
end |
Problem: if you try to resize the plot just a tiny bit pulling window border or corner using mouse it abruptly displays Y correctly but X not.
2) The same code with "beautifications" with just one-two more lines of code like here looks better. This kind of line widths and design actually have to be a default, and the code above has to be like this one below
| Code: | use clrwin
parameter (N=5)
real*8 X(N), Y(N)
Data X/1e1, 1e2, 1e3, 1e4, 1e5/
Data Y/2.2, 66, 8333, 1111, 777/
i=winio@('%sf%ts%bf%es&', 2d0)
call winop@("%pl[axes_pen=3,width=3,x_axis='X Axis Title',y_axis='Y Axis Title']")
i=winio@('%ww%pv%pl[native,framed,x_array,scale=log_log,N_GRAPHS=1]', 625,500, n, X, Y)
end |
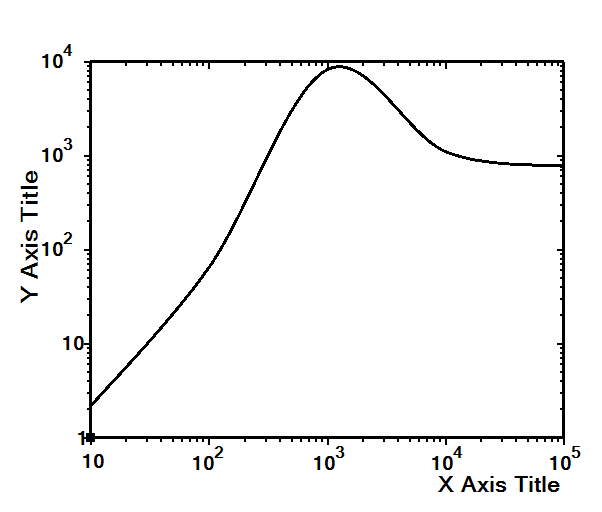
In other words, the lines for axis and curves with default width 1 pixel are unacceptable as a default. Such beautifications take a lot of time and always causes many recompilations. If Clearwin will make good looking plots it will be accepted like Matlab.
3) Additional problems: this nicer looking example shows the defects of absence of Scientific, Decimal etc numbering formatting options: the numbering does not look concise, in one style, it mixes different styles.
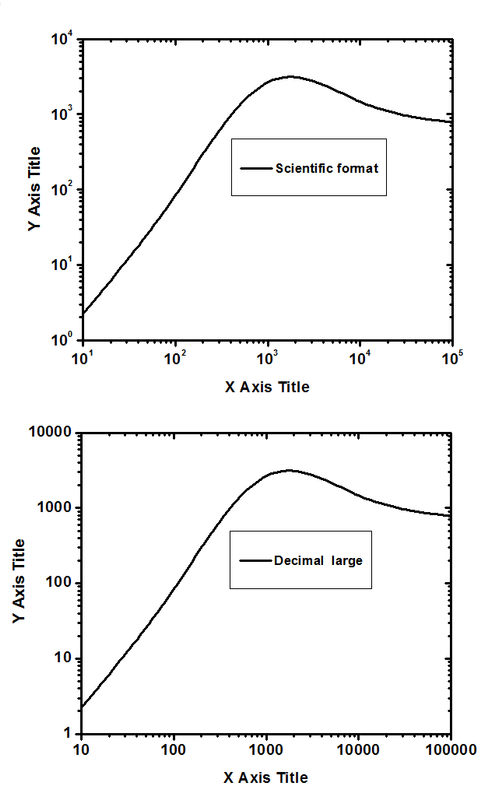
As to the numbering formats of LOG plots we here suggested to introduce few distinct user-definable formatting options: Scientific (numbers shown as 10^0, 10^1, 10^2, 10^3 etc) and Decimal (1, 10, 100, 1000...). All these ( and few other options like Engineering (1e0, 1e1, 1e2, 1e3) and Decimal with FP (1.0, 2.0, 3.0) ) are already there, they just need to be introduced into the user changeable settings.
With the LOG scale it is often possible for the code to choose these formats automatically: if the numbers are very small or very large and there are a lot of orders of magnitude to display then just the Scientific format has to be used
At the end here how this exact XY data is visualized by the professional scientific software using Scientific and Decimal formats. As you can compare the new %PL is already pretty close to the best of the best (the new PL can also do antialiasing for curves and in this example is even better doing data interpolation - compare how 8333 peak values are displayed)
Decimal format is of course the most difficult. If extend the plotted data to
| Code: | 0.01 0.011
0.1 0.044
1 0.33
10 2.2
100 66
1000 8333
10000 1111
100000 777 |
the OriginLab plots it this way
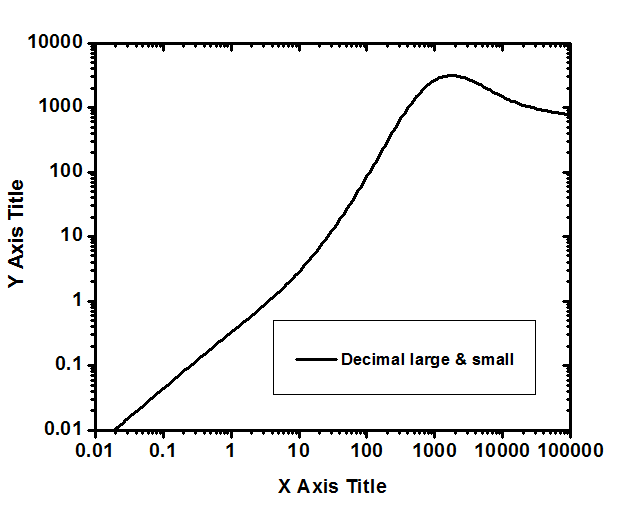
and if even more then 1e-3, 1e-4 ... |
|
|
| Back to top |
|
|
PaulLaidler
Site Admin
Joined: 21 Feb 2005
Posts: 7924
Location: Salford, UK
|
| Posted: Tue Apr 17, 2018 1:00 pm Post subject: |
|
|
Item 1 has now been fixed.
Improvements relating to item 3 might be possible later if time permits. |
|
| Back to top |
|
|
John-Silver

Joined: 30 Jul 2013
Posts: 1520
Location: Aerospace Valley
|
| Posted: Wed Apr 18, 2018 12:20 pm Post subject: |
|
|
Dan,
I too am running some tests and have seen some things which appear still to exist.
However, I'm still running v8.1+dlls23v8.3 combination and I've just seen that I don't get the same plots as you (scales)when I run your codes - that'll be the reason I suppose.
I'm going to install v8.3 now the perso version is available and will come back to you.
Just 2 points in the meantime:-
You say ...
| Quote: | | In other words, the lines for axis and curves with default width 1 pixel are unacceptable as a default. |
which I understand from your point of view (publications 'heavy definition' plots but for others (like myself) the thinner lines could be more applicable !!! Swings and roundabouts, what's good for one isn't necessarily for another (or vice versa)
Second thing.
Can you try the following with your examples please :-
When the window first opens, click the reduce to taskbar button top right without touching anything else.
Then immediatly recover the widow from the taskbar.
When I do this the window reappears BUT BLANK !!!
Further, if you then try to re-size that window, all works ok for reduction via the lo/r sides of the window, or from bottom edge,and indeed from the bottom corners BUT re-sizing can't be done using the top l/r corners !!! (the cursor doesn't change).
Strange behaviour, do you get the same ?
(I'm on Windows 7)
_________________
''Computers (HAL and MARVIN excepted) are incredibly rigid. They question nothing. Especially input data.Human beings are incredibly trusting of computers and don't check input data. Together cocking up even the simplest calculation ...  " " |
|
| Back to top |
|
|
DanRRight
Joined: 10 Mar 2008
Posts: 2815
Location: South Pole, Antarctica
|
| Posted: Wed Apr 18, 2018 2:54 pm Post subject: |
|
|
John,
1) There is no way to get not only production quality but any quality if axes_pen=1,width=1. But i agree my axes_pen=3, width=3 are probably too aggressive for anyone who uses less then 4K monitors. Try =2 and tell if that will look better (but take in mind that there is a bug with the frame width Paul just fixed)
So size=1 is too small for almost anyone but 3 are too large for anyone who use smaller resolutions. Of course with time all monitors will be 4K, 5K 8K, their prices dropped 10 times in last 3 years, i'v heard the first cell phone with 4k screen was just made. But the best solution which will fit everyone would be ( before it is too late and user base will be large) for Paul to consider the fp numbers for axes_pen and line width instead of integer numbers because antialiasing can allow any intermediate numbers like 1.4 and the plot automatically will look much better with line sizes larger then primitive 1 pixel
Though there might be people with low res monitors I strongly insist to not use 1 pixel for default, because no one in the world use that. Everyone who did all got out of business, just look at any packages of scientific graphics for Fortran over last 30 years supplied by such losers. While at the same time the Matlab for example almost killed all, taking lion part of the market share from Fortran. And when you will think why, you will find that the only what Matlab sells (having similar language with Fortran while Fortran is faster and more modern) all others missed is 1) ultimate simplicity 2) stellar graphics. Same was with Apple for example: ultimate simplicity, top parameters and stellar aesthetics. Same with Amazon: ultimate simplicity (one click orders), top convenience, good design. At the end anyone with very low res monitors can decrease line widths but for everyone else first look of the plot has to cause WOW effect (not the feelings that Fortran is the neanderthal's language like right now)
2) If i either decrease the plot size to zero by mouse resizing or minimize the plot it immediately crashes.
Last edited by DanRRight on Wed Apr 18, 2018 3:25 pm; edited 1 time in total |
|
| Back to top |
|
|
John-Silver
Joined: 30 Jul 2013
Posts: 1520
Location: Aerospace Valley
|
| Posted: Wed Apr 18, 2018 3:24 pm Post subject: |
|
|
interesting, different behaviour than me then, are you on Windows 10 ?
_________________
''Computers (HAL and MARVIN excepted) are incredibly rigid. They question nothing. Especially input data.Human beings are incredibly trusting of computers and don't check input data. Together cocking up even the simplest calculation ... " |
|
| Back to top |
|
|
DanRRight
Joined: 10 Mar 2008
Posts: 2815
Location: South Pole, Antarctica
|
| Posted: Tue Jun 26, 2018 12:38 am Post subject: |
|
|
| Paul, I hope you received on May 28 my email with demonstration of native PL crashing. |
|
| Back to top |
|
|
PaulLaidler
Site Admin
Joined: 21 Feb 2005
Posts: 7924
Location: Salford, UK
|
| Posted: Tue Jun 26, 2018 7:35 am Post subject: |
|
|
Dan
I think I did (too many balls in the air). If it concerned resizing then that bug has been fixed. |
|
| Back to top |
|
|
DanRRight
Joined: 10 Mar 2008
Posts: 2815
Location: South Pole, Antarctica
|
| Posted: Tue Jun 26, 2018 10:17 am Post subject: |
|
|
| This was about sensitivity to the input data when native %pl crashed after simpleplot_redraw@ was used. |
|
| Back to top |
|
|
PaulLaidler
Site Admin
Joined: 21 Feb 2005
Posts: 7924
Location: Salford, UK
|
| Posted: Tue Jun 26, 2018 1:26 pm Post subject: |
|
|
Dan
I have found your email, downloaded the archive and followed your instructions. The result is that I get "Reference to undefined variable" at line 3199 of crashPL.for. The variable is E3864_log(1) which is indeed undefined, at least according to SDBG64.
Am I missing something? |
|
| Back to top |
|
|
DanRRight
Joined: 10 Mar 2008
Posts: 2815
Location: South Pole, Antarctica
|
| Posted: Wed Jun 27, 2018 4:38 am Post subject: |
|
|
Most probably my instructions how to get the crash were not clear. The problem you see is because the data needs to be loaded first but it was not loaded, please load it first.
For simplicity I made just 3 tabs. Click first "Load Data", after data stops loading in couple seconds click "Working Case" button where in new window there are options to create few XY plots, you then can click any radiobuttons and see all works OK.
Close it using ESC and finally click on "Crashing Case" button, which is made programmatically similarly to the Working Case, and where you also will see few options to plot one or several XY graphs. You will see that initially all is plotted OK which tells that %PL is working OK but then clicking on any of radiobuttons causes crash because I suspect the simpleplot_redraw@ conflicts with something, most probably either being too sensitive to the data ranges or having a bug.
This whole demo was a simple case of using %PL when we have one set of X data and multiple sets of Y. The %PL makes one, two or several plots according to ON or OFF state of radiobuttons (multiplying specific Y(i) data on radiobutton state) and updating %PL with simpleplot_redraw@ |
|
| Back to top |
|
|
PaulLaidler
Site Admin
Joined: 21 Feb 2005
Posts: 7924
Location: Salford, UK
|
| Posted: Wed Jun 27, 2018 12:12 pm Post subject: |
|
|
Dan
I have spent an hour or so stepping through your program but at the moment I can't work out if there is anything wrong with %pl.
For me a failure occurs when I click on the "Plot case 1" radio button (to reset it) and it fails because the y-data to be plotted at this point contains at least one invalid floating point value. It's not out of range but some kind of NAN.
ClearWin+ should report a runtime failure (and this needs fixing) but after that I can't work out where the data is coming from. So maybe your data is invalid or %pl is not processing the data correctly.
The only thing that I can suggest at the moment is that you print out the data that you are plotting at this point to see it looks like. |
|
| Back to top |
|
|
DanRRight
Joined: 10 Mar 2008
Posts: 2815
Location: South Pole, Antarctica
|
| Posted: Wed Jun 27, 2018 8:35 pm Post subject: |
|
|
Thanks for the hunt of this devilry bug. I naively expected that since you have the source code of native PL the bug will be immediately catched in your own debug mode in your compiler where native PL was written. But I always forget that all developers prefer C++ and respect to debugging live even in pre-Anderthals era
I will look again at all arrays but strongly suspect that the only way NaN can be generated is by native PL own bug. Because this small simple code can not generate such thing in /check /debug /undef mode after successfully plotting the same arrays when window starts (at start both rariobuttons are ON).
I spent more then a month to find the bug checking everything and extracting this demo from large code and together with my other 2 decades experience with plotters like my own, OpenGL and Simpleplot led me to wish the debug mode not only in Fortran (where FTN95 is the world champ among all existing compilers, most probably not just Fortran type) but in native PL plotter and then entire Clearwin+ too. For sure native PL must have it. User set some PLdebugkey=1 and native PL will inspect data before plotting and tell which array and where has the problem.
The same kind checking options for %ls and other Clearwin+ controls for example would reveal undefined parameter or out of range value. But this thing for Clearwin+ is definitely deeper in the wish list, for now I'm sure the native PL must have such checking options first to be user friendly. In my own graphics made using FTN95 and its graphics libraries I can immediately use /debug and find what crashes the code, the native PL also needs something like that because inside it is much more complex then draw_line_between@ or OpenGL plotting commands.
But having a crash if some problem without a human readable explanation is not acceptable for Fortran users, they are probably ok only for computer science geeks.
UPDATE
---------------
There is no way the data can have any NaNs. Before plotting all data is compared to be >1e-30 and if NaN happen at this stage the Fortran code would inform before invoking simpleplot_update@. So the error happens inside the native PL |
|
| Back to top |
|
|
PaulLaidler
Site Admin
Joined: 21 Feb 2005
Posts: 7924
Location: Salford, UK
|
| Posted: Thu Jun 28, 2018 7:29 am Post subject: |
|
|
Dan
I have an open mind as to where the fault lies.
If I put a print statement at line 3204...
| Code: | Do ion=1, n7348423
Plot_ION_f_E(i,ion) = f_E_i_log (i,ion)/dE3864_log(i) * kP63457E(ion)
print*, Plot_ION_f_E(i,ion)
enddo
|
then some zeros are printed but I have no idea if that is significant. |
|
| Back to top |
|
|
|
|
You cannot post new topics in this forum
You cannot reply to topics in this forum
You cannot edit your posts in this forum
You cannot delete your posts in this forum
You cannot vote in polls in this forum
|
Powered by phpBB © 2001, 2005 phpBB Group
|

