 |
forums.silverfrost.com
Welcome to the Silverfrost forums
|
| View previous topic :: View next topic |
| Author |
Message |
aebolzan
Joined: 06 Jul 2007
Posts: 229
Location: La Plata, Argentina
|
 Posted: Thu Nov 17, 2016 11:43 am Post subject: Posted: Thu Nov 17, 2016 11:43 am Post subject: |
 |
|
Sorry!...by mistake I did not copy those files to the "include" folder but to the FTN95 one.......that's why the compiler did not find the subroutine...now all works fine, thanks!....I will try now with my own code..
Agustin |
|
| Back to top |
|
 |
DanRRight
Joined: 10 Mar 2008
Posts: 2826
Location: South Pole, Antarctica
|
| Posted: Thu Nov 17, 2016 7:13 pm Post subject: |
|
|
Paul,
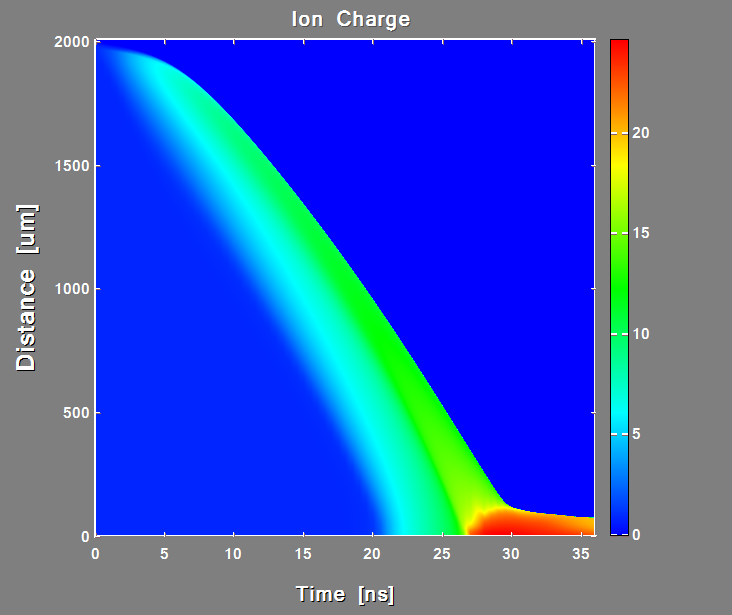
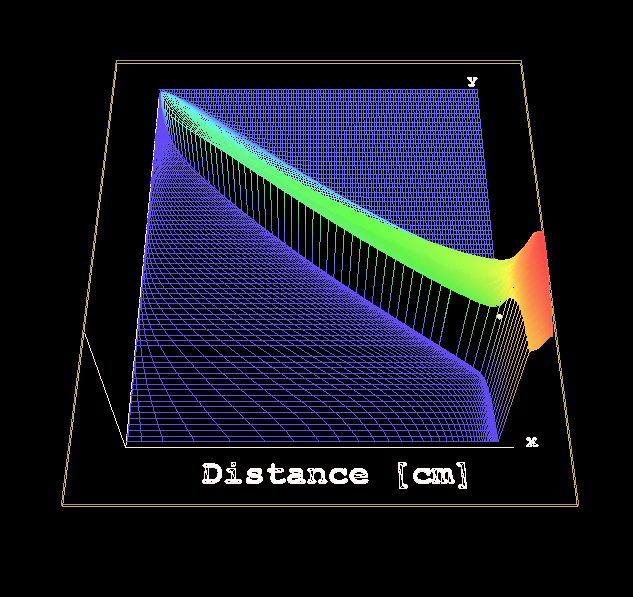
Can you please also create the boxed plotting surface like here ?
After finishing with XY plots obvious next logical step will be if new Plotter will also create such surface plots with just user providing data and clicking "run" it will be totally genial utility everyone want
Same for 3D plots (surfaceplot and 3D plots are sharing 99.999% of the source code)
 |
|
| Back to top |
|
|
PaulLaidler
Site Admin
Joined: 21 Feb 2005
Posts: 7933
Location: Salford, UK
|
| Posted: Fri Nov 18, 2016 8:13 am Post subject: |
|
|
Thanks Dan
The box should be easy. The rest maybe next week. |
|
| Back to top |
|
|
aebolzan
Joined: 06 Jul 2007
Posts: 229
Location: La Plata, Argentina
|
| Posted: Tue Nov 22, 2016 7:19 pm Post subject: |
|
|
I was trying to run your example program but using the option of x_array, with x_array changing from calc1 to calc2 subroutines.., so I have two data sets, x-y and x-z, so the program code is:
| Code: | PROGRAM main
USE mydata
n_points(1) = 0
n_points(2) = 0
i=winio@('%ww[no_border]%ca[Damped wave]%pv&')
i=winio@('%mn[Edit[Draw first,Draw second,Clear]]&', draw1, draw2,clear)
i=winio@('%fn[Tahoma]&')
i=winio@('%ts&', 1.1d0)
i=winio@('%tc&',rgb@(0,0,80))
i=winio@('%it&')
i=winio@('%`bg&',rgb@(230,255,225))
CALL winop@("%pl[native,independent]")
CALL winop@("%pl[n_graphs=2]")
CALL winop@('%pl[title="Sample plot"]')
CALL winop@("%pl[x_axis=Time(Milliseconds)]")
CALL winop@("%pl[y_axis=Amplitude@(-4.0)]")
CALL winop@("%pl[width=1]")
CALL winop@("%pl[smoothing=4]") ! anti-aliasing
CALL winop@("%pl[colour=red,style=2,pen_style=0,x_array]")
CALL winop@("%pl[colour=blue,style=2,pen_style=4,x_array]")
i=winio@("%pl",800,400,n_points,x,y,z)
END
|
However, the compiler says: too few arguments to satisfy winio@ format (continuation 7). I found some additional issues during plotting but I like to solved this one first....
Agustin |
|
| Back to top |
|
|
aebolzan
Joined: 06 Jul 2007
Posts: 229
Location: La Plata, Argentina
|
| Posted: Tue Nov 22, 2016 9:41 pm Post subject: |
|
|
Found the problem!!!.....although this is not clear in the notes (at least for me), seems that one has to provide as many as x_array/y_array pairs as needed, so that, the last statement in the previous code should be:
| Code: | | i=winio@("%pl",800,400,n_points,x1,y,x2,z) |
The other issue that I discovered is that the function Clear() must include now not only y=0.0 and z=0.0, but also x1=0.0, and x2=0.0 or one will observe that the x-axis remains at x=500 forever....
Agustin |
|
| Back to top |
|
|
PaulLaidler
Site Admin
Joined: 21 Feb 2005
Posts: 7933
Location: Salford, UK
|
| Posted: Wed Nov 23, 2016 9:05 am Post subject: |
|
|
Agustin
Yes. Maybe there was an error in my sample code.
When using the options [independent,x_array], the x and y arrays are in pairs otherwise there is just one x array. |
|
| Back to top |
|
|
DanRRight
Joined: 10 Mar 2008
Posts: 2826
Location: South Pole, Antarctica
|
| Posted: Wed Nov 23, 2016 12:24 pm Post subject: Re: |
|
|
| ... wrote: |
i=winio@('%fn[Tahoma]&')
i=winio@('%ts&', 1.1d0)
i=winio@('%tc&',rgb@(0,0,80))
i=winio@('%it&')
i=winio@('%`bg&',rgb@(230,255,225))
CALL winop@("%pl[native,independent]")
CALL winop@("%pl[n_graphs=2]")
CALL winop@('%pl[title="Sample plot"]')
CALL winop@("%pl[x_axis=Time(Milliseconds)]")
CALL winop@("%pl[y_axis=Amplitude@(-4.0)]")
|
Paul,
Why
CALL winop@...
not
i=winop@... ? |
|
| Back to top |
|
|
PaulLaidler
Site Admin
Joined: 21 Feb 2005
Posts: 7933
Location: Salford, UK
|
| Posted: Wed Nov 23, 2016 5:19 pm Post subject: |
|
|
Dan
The is nothing useful to return from winop@. |
|
| Back to top |
|
|
DanRRight
Joined: 10 Mar 2008
Posts: 2826
Location: South Pole, Antarctica
|
| Posted: Wed Nov 23, 2016 9:10 pm Post subject: |
|
|
Not all i=winio@ are useful either but some are. Formally these subroutines with CALL and functions with i=winio@ look and feel like they do the same things.
Why lose the possibility to have potential respond from function? This i=winio@
could be useful for something in future like generally useful is i=winio@
Besides CALLs break the style and confuse
On early stage of development it is possible to change things. Later this will be almost impossible.
Last edited by DanRRight on Wed Nov 23, 2016 9:22 pm; edited 1 time in total |
|
| Back to top |
|
|
PaulLaidler
Site Admin
Joined: 21 Feb 2005
Posts: 7933
Location: Salford, UK
|
| Posted: Wed Nov 23, 2016 9:18 pm Post subject: |
|
|
| OK. I will look into that. |
|
| Back to top |
|
|
aebolzan
Joined: 06 Jul 2007
Posts: 229
Location: La Plata, Argentina
|
| Posted: Thu Nov 24, 2016 5:26 pm Post subject: |
|
|
Dear Paul,
I have found some problems with the locations of tick labels. As I am trying to implement the new %pl for plotting different types of data sets during the run of the program (they can be Current-Time, Potential-Time, Current-Potential, etc.), I have implemented a Function Legend that changes the Axis labels depending on what is plotted at a certain time. The result is that the tick labels can appear correctly located below the x-axis, for instance, but once I plotted a second data set, they move upwards (the same for the y-axis) and remain there for the rest of the run. See this code, for instance:
[code]WINAPP
MODULE mydata
USE clrwin
INTEGER n_points(2)
REAL*8 xstart(2),dx(2)
INTEGER,PARAMETER::n=1000
REAL*8:: y(n)=0.0,z(n)=0.0,w(n)
integer*4 :: ancho,alto
logical*4 :: plot=.false.
CONTAINS
INTEGER FUNCTION legend()
integer ancho2,alto2,alto3,ancho3
ancho2=ancho/2.0
alto2=alto-20
ancho3=ancho*0.05
alto3=alto/2.0
if(plot) then
CALL draw_characters@("Time/s", ancho2, alto2, 0)
CALL rotate_font@(90.0D0)
CALL draw_characters@("Current/A", ancho3, alto3, 0)
CALL rotate_font@(0.0D0)
endif
legend = 2
END FUNCTION legend
SUBROUTINE calc1(k)
INTEGER i,x,k
DOUBLE PRECISION p1,p2,p3
p1=1.5d0
p2=150.0d0
p3=15d0
x=0
plot=.true.
DO i=1,k
y(i)=p1*exp(-x/p2)
x=x+1
ENDDO
END SUBROUTINE calc1
SUBROUTINE calc2(k)
INTEGER i,x,k
DOUBLE PRECISION p1,p2,p3
p1=1.0d0
p2=150.0d0
p3=20d0
x=0
plot=.true.
DO i=1,k
z(i)=p1*exp(-x/p2)
x=x+1
ENDDO
END SUBROUTINE calc2
SUBROUTINE calc3(k)
INTEGER i,x,k
DOUBLE PRECISION p1,p2,p3
p1=2.0d0
p2=150.0d0
p3=20d0
x=0
plot=.true.
DO i=1,k
w(i)=p1*exp(-x/p2)
x=x+1
ENDDO
END SUBROUTINE calc3
INTEGER FUNCTION draw1()
CALL calc1(n_points(1))
CALL simpleplot_redraw@()
draw1 = 2
END FUNCTION draw1
INTEGER FUNCTION draw2()
CALL calc2(n_points(2))
CALL simpleplot_redraw@()
draw2 = 2
END FUNCTION draw2
INTEGER FUNCTION clear()
y = 0.0d0
z = 0.0d0
w = 0.0d0
plot=.false.
CALL simpleplot_redraw@()
clear = 2
END FUNCTION clear
INTEGER FUNCTION change()
INTEGER i
if(n_points(2) == 500)then
n_points(2) = 1000
dx(2) = 1.0d0
CALL calc3(1000)
i = CHANGE_GRAPH_STYLE@(2,0,0,255)
i = CHANGE_GRAPH_DATA@(2,0.0d0,w)
else
n_points(2) = 500
dx(2) = 2.0d0
CALL calc2(500)
i = CHANGE_GRAPH_STYLE@(2,2,4,RGB@(0,0,255))
i = CHANGE_GRAPH_DATA@(2,0.0d0,z)
endif
CALL simpleplot_redraw@()
change = 2
END FUNCTION change
END MODULE mydata
PROGRAM main
USE mydata
external legend
ancho=0.8*clearwin_info@('SCREEN_WIDTH')
alto=0.8*clearwin_info@('SCREEN_DEPTH')
n_points(1) = 1000
n_points(2) = 500
xstart = 0.0d0
dx(1) = 1.0d0
dx(2) = 2.0d0
i=winio@('%ww[no_border]%ca[Damped wave]%pv&')
i=winio@('%mn[Edit[Draw first,Draw second,Change second,Clear |
|
| Back to top |
|
|
PaulLaidler
Site Admin
Joined: 21 Feb 2005
Posts: 7933
Location: Salford, UK
|
| Posted: Thu Nov 24, 2016 6:04 pm Post subject: |
|
|
| Thanks. I will take a look at it. |
|
| Back to top |
|
|
aebolzan
Joined: 06 Jul 2007
Posts: 229
Location: La Plata, Argentina
|
| Posted: Thu Nov 24, 2016 6:36 pm Post subject: |
|
|
Ooopppss....seems that the code is incomplete. This is the main program:
| Code: | PROGRAM main
USE mydata
external legend
ancho=0.8*clearwin_info@('SCREEN_WIDTH')
alto=0.8*clearwin_info@('SCREEN_DEPTH')
n_points(1) = 1000
n_points(2) = 500
xstart = 0.0d0
dx(1) = 1.0d0
dx(2) = 2.0d0
i=winio@('%ww[no_border]%ca[Damped wave]%pv&')
i=winio@('%mn[Edit[Draw first,Draw second,Change second,Clear]]&', draw1, draw2,change,clear)
i=winio@('%fn[Tahoma]&')
i=winio@('%ts&', 1.1d0)
i=winio@('%tc&',rgb@(0,0,80))
i=winio@('%it&')
i=winio@('%`bg&',rgb@(230,255,225))
CALL winop@("%pl[native,independent]")
CALL winop@("%pl[n_graphs=2]")
CALL winop@('%pl[title="Sample plot"]')
CALL winop@("%pl[x_axis=@]")
CALL winop@("%pl[y_axis=@]")
CALL winop@("%pl[width=1]")
CALL winop@("%pl[smoothing=4]") ! anti-aliasing
CALL winop@("%pl[colour=red,style=2,pen_style=0]")
CALL winop@("%pl[colour=blue,style=2,pen_style=4]")
i=winio@("%^pl",ancho,alto,n_points,xstart,dx,y,z,legend)
END |
|
|
| Back to top |
|
|
DanRRight
Joined: 10 Mar 2008
Posts: 2826
Location: South Pole, Antarctica
|
| Posted: Thu Nov 24, 2016 8:22 pm Post subject: |
|
|
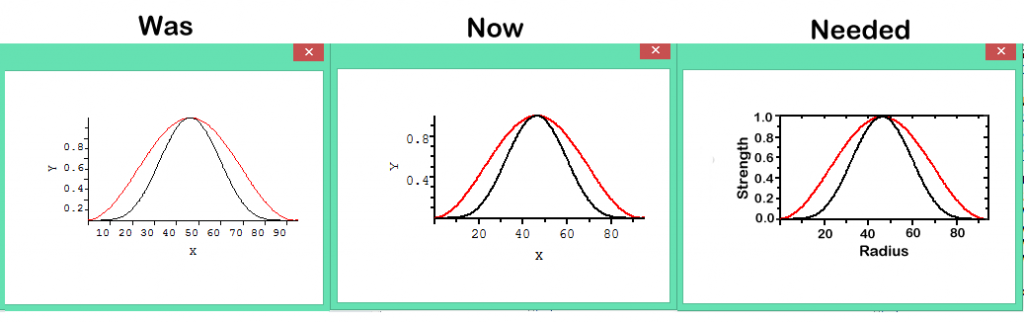
What I also missed in %pl and had no explanation why it was not included was keyword Y_MAX=Value. It has Y_MIN=Value but not Y_MAX.
Last edited by DanRRight on Thu Nov 24, 2016 8:46 pm; edited 1 time in total |
|
| Back to top |
|
|
aebolzan
Joined: 06 Jul 2007
Posts: 229
Location: La Plata, Argentina
|
| Posted: Thu Nov 24, 2016 8:36 pm Post subject: |
|
|
what I have not checked is if [x_array] and [xmin,dx] are exclusive options.....although it seems so.....more interesting is the fact that the location of ticks follows a very funny code: it is impossible to know what the plot will show....until it appears...
Using [x_array] you can select somehow the xmin and xmax limits of the data in a plot, but I also found some strange consequences of this (in the tick labels) that I am still investigating....
Agustin |
|
| Back to top |
|
|
|
|
You cannot post new topics in this forum
You cannot reply to topics in this forum
You cannot edit your posts in this forum
You cannot delete your posts in this forum
You cannot vote in polls in this forum
|
Powered by phpBB © 2001, 2005 phpBB Group
|

