 |
forums.silverfrost.com
Welcome to the Silverfrost forums
|
| View previous topic :: View next topic |
| Author |
Message |
PaulLaidler
Site Admin
Joined: 21 Feb 2005
Posts: 7925
Location: Salford, UK
|
 Posted: Mon Jun 22, 2020 6:30 pm Post subject: Posted: Mon Jun 22, 2020 6:30 pm Post subject: |
 |
|
| You should use the latest mod and ins files from the last link on this thread. You won't find them in the other download. |
|
| Back to top |
|
 |
Martin_K
Joined: 09 Apr 2020
Posts: 227
|
| Posted: Mon Jun 22, 2020 7:40 pm Post subject: |
|
|
Thanks Paul!
I used the latest .mod and .ins files with the v48 DLLs and after you modified the DLLs, now, NEARLY everything works for me problem free
(with classical direct calls to SIMPLEPLOT_REDRAW@!). So, there is no need to re-code some parts of my program (very joyful info for me)!
Again - many thanks, Paul!
Just still one small issue/question to SYMBOL=12:
After several clicks on zoom in or zoom out and then a click on zoom to extents, SOMETIMES (not always and I did NOT observed some systematic behaviour, only random behaviour) I get instead of PLUS (+) signs, a rectangular symbol (see picture below):
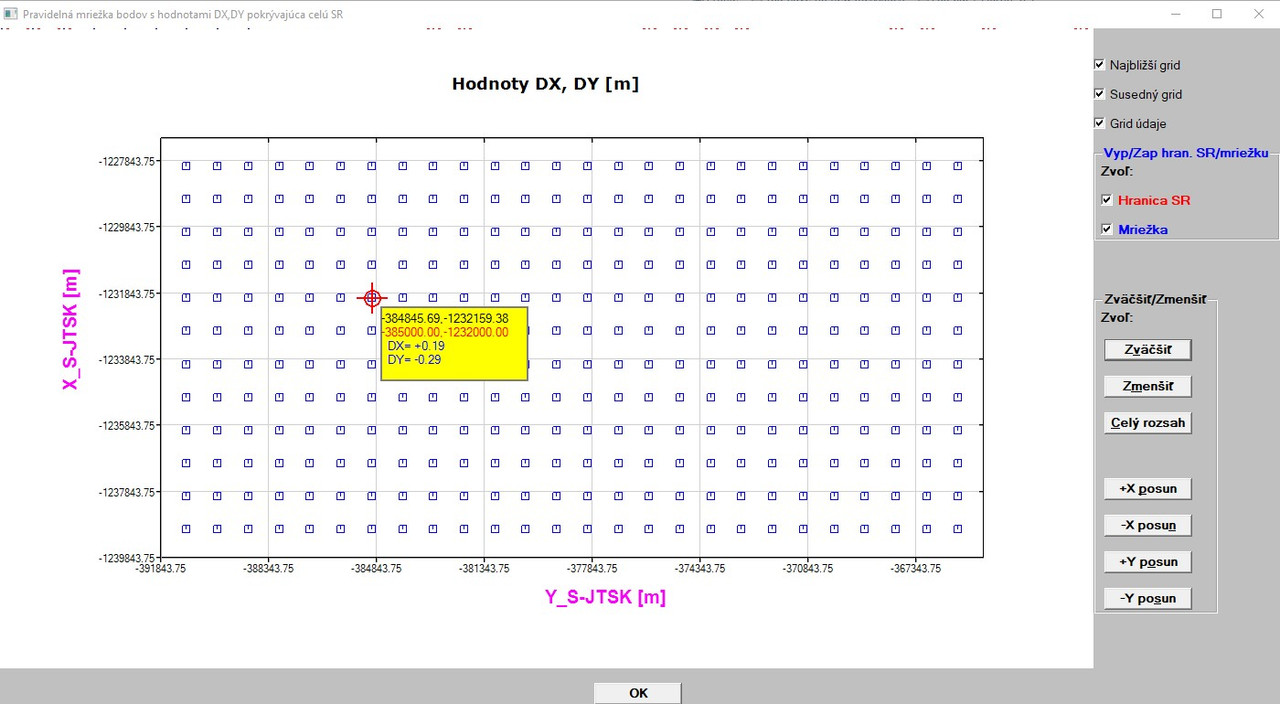
Do you have any idea, why it occurs?
Martin |
|
| Back to top |
|
|
Kenneth_Smith
Joined: 18 May 2012
Posts: 697
Location: Hamilton, Lanarkshire, Scotland.
|
| Posted: Mon Jun 22, 2020 8:42 pm Post subject: |
|
|
Martin,
Do you have any calls to CHANGE_PLOT_INT@ in your code where the second argument is symbol ?
Ken |
|
| Back to top |
|
|
Martin_K
Joined: 09 Apr 2020
Posts: 227
|
| Posted: Mon Jun 22, 2020 9:12 pm Post subject: |
|
|
Ken,
YES - see the code below
(call back) for switching on/off graphics:
| Code: |
INTEGER FUNCTION akt_cb_graf() ! updates/redraws graphics based on
! the user´s selected options
USE CLRWIN
IMPLICIT NONE
INTEGER*4 akt_cb_graf
if (skok_modul.eq.0) then ! draws and switches on/off both SK border and grid
if (control(1).eq.1) then ! switch on/off the SK border
k = CHANGE_PLOT_INT@(handle_pl_hr,'link',1,1)
call simpleplot_redraw@()
else
k = CHANGE_PLOT_INT@(handle_pl_hr,'link',1,0)
call simpleplot_redraw@()
end if
if (control(2).eq.1) then ! switch on/off the grid
k = CHANGE_PLOT_INT@(handle_pl,'symbol',0,1)
call simpleplot_redraw@()
else
k = CHANGE_PLOT_INT@(handle_pl,'symbol',0,0)
call simpleplot_redraw@()
end if
else ! draws grid ONLY (without SK border)
if (control(2).eq.1) then ! switch on/off the grid
k = CHANGE_PLOT_INT@(handle_pl,'symbol',0,1)
call simpleplot_redraw@()
else
k = CHANGE_PLOT_INT@(handle_pl,'symbol',0,0)
call simpleplot_redraw@()
end if
end if
akt_cb_graf = 1
END FUNCTION akt_cb_graf
|
|
|
| Back to top |
|
|
Kenneth_Smith
Joined: 18 May 2012
Posts: 697
Location: Hamilton, Lanarkshire, Scotland.
|
| Posted: Mon Jun 22, 2020 9:47 pm Post subject: |
|
|
Martin
The following will set graph 0 to symbol 0 i.e. no symbol:
| Code: | | k = CHANGE_PLOT_INT@(handle_pl,'symbol',0,0) |
while the following will set graph 0 to symbol 1, which is the box symbol that is being drawn occasionally.
| Code: | | k = CHANGE_PLOT_INT@(handle_pl,'symbol',0,1) |
Perhaps this should be:
| Code: | | k = CHANGE_PLOT_INT@(handle_pl,'symbol',0,12) |
BUT there is also be another potential problem, as you appear to have numbered the graphs from 0 to 1. Perhaps this should be 1 and 2 ?
The %pl help page says:
| Quote: | INTEGER FUNCTION CHANGE_PLOT_INT@(id, option, index, dval)
INTEGER FUNCTION CHANGE_PLOT_DBL@(id, option, index, fval)
index corresponds to the number of the graph (starting at 1).
|
Ken
PS you have six calls to simpleplot_redraw@, so this will be called multiple times depending on the results of the IF/ELSE/THEN construction.
A single call to simpleplot_redraw@, before the return value of the function is set is sufficient. |
|
| Back to top |
|
|
John-Silver

Joined: 30 Jul 2013
Posts: 1520
Location: Aerospace Valley
|
| Posted: Mon Jun 22, 2020 10:22 pm Post subject: |
|
|
Paul,
I'm just trying to keep upwith the consistency of the various updates of the last few days.
At the top of Page 4 of this thread you wrote today:
| Quote: | | You should use the latest mod and ins files from the last link on this thread. You won't find them in the other download. |
.... by which !i assume you l=mean the last link on the previous page, which is the 'Sticcky' Post
... but I don't see any 'mod' or 'ins' files in the downloads there.
The DLLs48 doesn't include anything but ... dlls
... and what's 'the other download' you refer to ?
_________________
''Computers (HAL and MARVIN excepted) are incredibly rigid. They question nothing. Especially input data.Human beings are incredibly trusting of computers and don't check input data. Together cocking up even the simplest calculation ...  " "
Last edited by John-Silver on Mon Jun 22, 2020 10:25 pm; edited 1 time in total |
|
| Back to top |
|
|
John-Silver
Joined: 30 Jul 2013
Posts: 1520
Location: Aerospace Valley
|
| Posted: Mon Jun 22, 2020 10:23 pm Post subject: |
|
|
btw, thanks for the list of the parameters in 'PARAM'
_________________
''Computers (HAL and MARVIN excepted) are incredibly rigid. They question nothing. Especially input data.Human beings are incredibly trusting of computers and don't check input data. Together cocking up even the simplest calculation ... " |
|
| Back to top |
|
|
Kenneth_Smith
Joined: 18 May 2012
Posts: 697
Location: Hamilton, Lanarkshire, Scotland.
|
|
| Back to top |
|
|
John-Silver
Joined: 30 Jul 2013
Posts: 1520
Location: Aerospace Valley
|
| Posted: Mon Jun 22, 2020 10:47 pm Post subject: |
|
|
ah ok, then it's the penultimate previous link from June 19th for the ins and mod files
Thanks for clearing that up Ken, I'm sure Paul will be updating the 'Sticky' Post with those files added.
_________________
''Computers (HAL and MARVIN excepted) are incredibly rigid. They question nothing. Especially input data.Human beings are incredibly trusting of computers and don't check input data. Together cocking up even the simplest calculation ... " |
|
| Back to top |
|
|
Martin_K
Joined: 09 Apr 2020
Posts: 227
|
| Posted: Mon Jun 22, 2020 10:58 pm Post subject: |
|
|
Thanks Ken!
I reduced the calls to SIMPLE_PLOT@ function as you mentioned.
Some time ago I had the numbers 1,2 for the graphs and at that time I tried something
to fix and forgot to change it back.
So, I changed it to 1 and 2 now, but the symptom remains.
You write that it could perhaps be:
| Code: |
k = CHANGE_PLOT_INT@(handle_pl,'symbol',0,12)
|
I am confused either with the code above or with the help for the function
CHANGE_PLOT_INT@.
The 4th argument in the function
CHANGE_PLOT_INT@ is (according to help):
dval, fval and sval represent the value to be changed
So, I thought when the checkbox is checked, the 4th argument has the value 1 and it is the argument which is to be changed to 0 (checkbox unchecked, graphics removed and vice versa).
How can I use as the 4th argument the number 12 (this should be known by the use of SYMBOL parameter - argument No. 2 - in the function CHANGE_PLOT_INT@)?
Or am I again totally wrong?
Martin
P.S. BTW - I used the number 0 as 3rd argument, since help says:
index corresponds to the number of the graph (starting at 1). Set this to zero when the dval/fval/sval applies to all graphs.
Therefore ,some time ago, I tried with the number 0 for the 3rd argument. |
|
| Back to top |
|
|
Kenneth_Smith
Joined: 18 May 2012
Posts: 697
Location: Hamilton, Lanarkshire, Scotland.
|
| Posted: Mon Jun 22, 2020 11:56 pm Post subject: |
|
|
Martin,
| Code: | | k = CHANGE_PLOT_INT@(handle_pl,'symbol',1,12) |
means change %pl with handle_pl, graph 1, symbol to symbol type 12.
This is independent of the value of the control. You use the value of the control, within the IF/ELSE/THEN construct to select the appropriate call to change_plot_int@ for example for control(2) if it is your grid and thats graph 2
| Code: | If (control(2) .eq. 1) then !GRID ON
k = CHANGE_PLOT_INT@(handle_pl,'symbol',2,12)
else ! GRID OFF
k = CHANGE_PLOT_INT@(handle_pl,'symbol',2,0)
end if
|
Dont set the 3rd argument to 0, since this applies to all graphs, consequently a change to graph 1 or 2 made earlier in the function will be reset! This is not something I would normally do and that is why I read your code above as set graph 0 rather than set all graphs. In anycase it did strike me a looking odd and there is an issue there.
The logic in the IF/ELSE/THEN construction appears to be over complex.
You may have to revisit all calls to CHANGE_PLOT_INT@, CHANGE_PLOT_DBL@, and CHANGE_PLOT_CHR@
Last edited by Kenneth_Smith on Tue Jun 23, 2020 10:20 am; edited 1 time in total |
|
| Back to top |
|
|
John-Silver
Joined: 30 Jul 2013
Posts: 1520
Location: Aerospace Valley
|
| Posted: Tue Jun 23, 2020 12:34 am Post subject: |
|
|
Martin,
the documentation you refer to can be slightly confusing if you're not used to the terminology used.
All the Change_PLOT_INT@ is doing is: for window'argument1', change the value of the variable 'argument 2', to value 'argument 4', for curve (see note *) number 'argument 3' only.
The value of the arguments has no direct influence to or from your checkbox !
The INT in the command name means the variable must be an INTeger, while there are the equivalent commands for real and CHAracter variables also. Hence the line you quote
| Quote: | | dval, fval and sval represent the value to be changed |
(which areDouble precision integer value, Floatingpoint real value or character String value respectively) and which actually apply to all 3 commands depending on the variable type.
------------------------------------------
Note (*) -
Talking of confusing terminology,
A minor personal bug-bear of mine is the use of the word 'graph' in the documentation to mean 'curve'. A graph for me is the whole entity plotted.
Curve on the other hand is defined in the dictionary as:
A line on a graph (whether straight or curved) showing how one quantity varies with respect to another.
A graph is defined as:
A diagram showing the relation between variable quantities, typically of two variables, each measured along one of a pair of axes at right angles
whereas plot in the sense used in 'Simpleplot' refers more to the action of plotting the graph
PLOT , which I think we can say is the terminology of reference within native %pl for 'the overall graphic'could refer equally to plotting primitive shapes, or indeed anything with connected lines.
When is a plot not a plot ?, when it's is a graph ... as Robert Zimmerman might one day write into one of his songs
Although i won't be holding back 5 dollars to bet on him writing a ditty about Simpleplot , sorry native %pl, we musn't get mixed up, as not a lot will scan with 'native %pl' (apart of course from the location from which you often claim many of your program bug problems come from DanRRight LOL ) ... 'The Ballad of Devilry Blighted Dan' one day maybe
But I doth digress.
Not that all that is all that important.[/b]
_________________
''Computers (HAL and MARVIN excepted) are incredibly rigid. They question nothing. Especially input data.Human beings are incredibly trusting of computers and don't check input data. Together cocking up even the simplest calculation ... " |
|
| Back to top |
|
|
Martin_K
Joined: 09 Apr 2020
Posts: 227
|
| Posted: Tue Jun 23, 2020 11:12 pm Post subject: |
|
|
Thanks Ken (and John) for your clear explanation!
Now, I am afraid, I have no talent to read the manuals and understand the
manuals correctly.
So, I amended my code as you explained, Ken!
Nevertheless, it seems to me that there is still a problem with symbol 12 (and also with symbol 13). Although, after correction of my code, zooming in/out/to extents functions always correctly
(there is no change in the graphical symbol) and I see always symbol 12 or 13 after zooming. This time the problem
is moved to switching on/off the graphs. As soon as I switch off the grid and then I want to switch it on back, it never displays. I have to close the graphs first and then re-open them to see the grid.
So, I tried another graphical symbol (symbol 2, triangle) to test it. With this symbol (SYMBOL=2) EVERYTHING (any graphical function) works perfectly!
The only problem with SYMBOL=2 is that it is not quite suitable for me when
all points (87312 grid points+47041 border points) are displayed in their initial scale at once. I see only a blue filled rectangular area. Only when I start to zoom in,
I can clearly see particular points (as triangles) with all related data.
Since there is no dot (.) symbol for choosing as a point graphical symbol, for my purposes the plus sign (+) seems to be the best option (even symbol=13 is less suitable than 12).
Thanks again for your valuable advises!
Martin |
|
| Back to top |
|
|
John-Silver
Joined: 30 Jul 2013
Posts: 1520
Location: Aerospace Valley
|
| Posted: Wed Jun 24, 2020 7:33 am Post subject: |
|
|
Martin,
symbol=10 is a dot (in it's generalised form , a circle ) when you choose a sufficiently small size via symbol_size.
(Default symbol size is 8x8, which is large anyway for your application)
... and even, as I've just realised, is symbol=11 which Paul has somehat cryptically named 'disc' as opposed to 'filled circle ! )
However, I'm surprised you see anything no matter which symbol/size you choose.
I went back to your original problem post and on the (zoomed in) plots you show there I counted 1404 points (plus signs) on one example plot.
If you have a grid with 87312 points that's an increase in density of symbols of >60 , or spacing of about 8 times less for the symbols, for an unzoomed plot !
Assuming your on a standard 90 dpi display that doesn't give much scope for getting a particularly 'visible' unzoomed plot does it ?... even with = signs or 'dots'.
In fact, I'd say dots at the minimum size (2x2 ?) is going to be the only feasible option but then how does that look when you zoom in ? very small i imagine. If that's the case, maybe a clever dynamic re-sizing of the symbols based on zoom level (detected 'on-the-fly' would be the ideal solution ?
_________________
''Computers (HAL and MARVIN excepted) are incredibly rigid. They question nothing. Especially input data.Human beings are incredibly trusting of computers and don't check input data. Together cocking up even the simplest calculation ... " |
|
| Back to top |
|
|
Kenneth_Smith
Joined: 18 May 2012
Posts: 697
Location: Hamilton, Lanarkshire, Scotland.
|
| Posted: Wed Jun 24, 2020 8:21 am Post subject: |
|
|
Martin,
I think we need to see a small example that demonstrates the issue you have having.
The sample code below which includes zoom in/out, pan left/right/up/down and graph on/off (using symbol =12) does not exhibit the behaviour you are describing.
The problem appears to be with your coding, rather than an issue with how the library treats symbol 12.
Ken
https://www.dropbox.com/s/m3ucoa4zlqgeyj7/martin2.f95?dl=0 |
|
| Back to top |
|
|
|
|
You cannot post new topics in this forum
You cannot reply to topics in this forum
You cannot edit your posts in this forum
You cannot delete your posts in this forum
You cannot vote in polls in this forum
|
Powered by phpBB © 2001, 2005 phpBB Group
|

