 |
forums.silverfrost.com
Welcome to the Silverfrost forums
|
| View previous topic :: View next topic |
| Author |
Message |
PaulLaidler
Site Admin
Joined: 21 Feb 2005
Posts: 7925
Location: Salford, UK
|
 Posted: Mon May 18, 2020 12:37 pm Post subject: Posted: Mon May 18, 2020 12:37 pm Post subject: |
 |
|
Martin
In my opinion it is not reasonable to judge ClearWin+ on the basis of your experience with %pl. %pl is a very small part of a very large library and your application of %pl is way above its designed purpose. |
|
| Back to top |
|
 |
Martin_K
Joined: 09 Apr 2020
Posts: 227
|
| Posted: Tue May 19, 2020 12:14 pm Post subject: |
|
|
Ken,
your code (with coordinates next to cursor) works PERFECT - thanks!
It means - the cursor shows the X,Y geodetical coordinates as defined previously in the graph (so it shows in the volatile small rectangular area something like this -1485265, -495564 and the X, Y coordinates are changing as cursor moves. Again, PERFECT!)
But I wanted to learn and achieve a little bit another thing. I will try to explain it here once again:
I read in a data from a file (87000+ points) which looks like this:
-1335000 -492000 -0.96 -0.84
-1335000 -491000 -0.97 -0.83
-1335000 -490000 -0.97 -0.82
-1335000 -489000 -0.98 -0.81
.....
.....
My goal is to show at the cursor (when I point with the cursor over a point
in the graph) its DX, DY values . It means (for example, when I point with cursor to the first point in the list above), I wanted to see preferably its DX, DY variations: -0.96, -0.84.
It could also be connected with X,Y, so the cursor would show
-1335000 -492000 -0.96 -0.84. But in any case, the DX,DY variations are very important, therefore I need them to see at the cursor position when hovering over a concrete point in the graph.
And here - I have no idea how to achieve it.
Thanks in advance for your comments. |
|
| Back to top |
|
|
Kenneth_Smith
Joined: 18 May 2012
Posts: 697
Location: Hamilton, Lanarkshire, Scotland.
|
| Posted: Tue May 19, 2020 1:55 pm Post subject: |
|
|
Martin,
I wrote the following before your last post:
I my example code shows you how to convert pixel coordinates to real world coordinates. With the real world coordinates, a search for the nearest actual grip point would be possible and I had wrongly assumed that you had a methodology to achieve this.
A brute force approach i.e. scanning all your data points would be intensive. However, at the zoom level where picking a grid point is feasible, it may be possible to scan all the grid data once, to produce a reduced set of grid points that are in the current window, i.e. do this immediately after a zoom action. Then when you move the mouse about in a zoomed in widow you have a much smaller data set to operate on. This may become practical depending on what data structures that exist prior to the call to %pl. You might have to some duplicate information.
Consider this, as your grid coordinates appear to be equally spaced in the X and Y directions, consider using real arrays XX(1:N) with x grid coordinates and YY(1:M) with y grid coordinates.
This would allow a quicker nearest neighbour scan of just XX and YY and the location values from theses scans point to the physical location in an integer (1:N,1:M) array. The NR routines LOCATE and HUNT (probably better for this application) come to mind.
Your (1:N,1:M) integer array, would contain the index values to another set of arrays which contain the other data (whatever they are) associated with your storage grid points. All of this is separate and in addition to the data you pass to the plotting routine. |
|
| Back to top |
|
|
PaulLaidler
Site Admin
Joined: 21 Feb 2005
Posts: 7925
Location: Salford, UK
|
| Posted: Tue May 19, 2020 1:57 pm Post subject: |
|
|
| Code: | MODULE plData
USE clrwin
INTEGER(7) hwnd
CONTAINS
INTEGER FUNCTION cb()
CHARACTER(80) status,reason
DOUBLE PRECISION x,y
reason = clearwin_string@("CALLBACK_REASON")
IF(reason == "MOUSE_MOVE")THEN
ix = clearwin_info@("GRAPHICS_MOUSE_X")
iy = clearwin_info@("GRAPHICS_MOUSE_Y")
i = get_plot_data@(ix,iy,x,y)
status = " "
IF(x >= 0d0 .AND. y >= 0d0 .AND. x <= 1d0 .AND. y <= 1d0)THEN
write(status,"(a,i3,a,i3,a)") ' Point(',ix,',',iy,')'
CALL set_status_text@(hwnd,0,status)
write(status,"(a,f6.2,a,f6.2,a)") ' Value(',x,',',y,')'
ELSE
CALL set_status_text@(hwnd,0,status)
ENDIF
CALL set_status_text@(hwnd,1,status)
ENDIF
cb = 2
END FUNCTION
END MODULE plData
!-----------------------------------------------------------------------------------------------
PROGRAM main
USE plData
INTEGER,PARAMETER:: N=11,M=2
DOUBLE PRECISION x(N),y(N)
INTEGER i,sbparts(M)
DATA sbparts /26,-1/
DO i=1,N
x(i)=0.1d0*(i-1)
y(i)=x(i)*x(i)
ENDDO
i = winio@('%ww%ca[ClearWin+]&')
i = winio@('%bg[BTNFACE]&')
CALL winop@("%pl[title=Quadratic]")
CALL winop@("%pl[width=2]")
CALL winop@("%pl[x_array]")
CALL winop@("%pl[link=curves]")
CALL winop@("%pl[symbol=9]")
CALL winop@("%pl[colour=red]")
CALL winop@("%pl[pen_style=2]")
CALL winop@("%pl[frame,gridlines]")
CALL winop@("%pl[y_sigfigs=2]")
CALL winop@("%pl[y_axis=y-data]")
CALL winop@("%pl[x_max=1.0]")
CALL winop@("%pl[y_max=1.0]")
CALL winop@("%pl[dx=0.2]")
CALL winop@("%pl[dy=0.2]")
CALL winop@("%pl[full_mouse_input]")
i=winio@('%`bg[white]&')
i=winio@('%`*sb%lc&', M, sbparts, hwnd)
i=winio@('%`bg&',RGB@(252,252,252))
i=winio@('%pv%^pl',400,250,N,x,y,cb)
END PROGRAM
|
|
|
| Back to top |
|
|
Kenneth_Smith
Joined: 18 May 2012
Posts: 697
Location: Hamilton, Lanarkshire, Scotland.
|
| Posted: Tue May 19, 2020 4:06 pm Post subject: |
|
|
This demonstrates the concept I tried to explain above, obviously, the call to locate_dp and the logical function that test the returned value should be packaged into a single routine.
| Code: | module from_kss_lib
implicit none
contains
!--------------------------------------------------------------------------------------------------
! #063 subroutine locate (xx, n, x, j)
! Given an array xx(1:n), and given a value x, returns a value j such that x is between
! xx(j) and xx(j+1). xx(1:n) must be monotonic, either increasing or decreasing. j=0 or
! j=n is returned to indicate that x is out of range.
!--------------------------------------------------------------------------------------------------
subroutine locate_dp(xx, n, x, j)
implicit none
integer, parameter :: dp = kind(1.d0)
integer, intent(out) :: j
integer, intent(in) :: n
real(kind = dp), intent(in) :: x
real(kind = dp), dimension(1:n), intent(in) :: xx
real, parameter :: zero_dp = 0.0d0
integer jl, jm, ju
jl = 0 ; ju = n + 1
do while (ju-jl .gt. 1)
jm = (ju + jl)/2
if ((xx(n) .ge. xx(1)) .eqv. (x .ge. xx(jm))) then
jl = jm
else
ju = jm
endif
end do
if ((abs(x - xx(1)) .gt. zero_dp) .eqv. .false.) then
j = 1
else if ((abs(x - xx(n)) .gt. zero_dp) .eqv. .false.) then
j = n-1
else
j = jl
endif
end subroutine locate_dp
end module from_kss_lib
program main
use from_kss_lib
implicit none
real*8 xx(1:10), xtest
integer i,j
do i = 1, 10, 1
xx(i) = dble(i)
end do
do i = 1,20, 1
xtest = 10.d0*random@()
call locate_dp(xx, 10, xtest, j)
if (j .eq. 0) then
print*, xtest, ' outside range'
else if (j .eq. 10) then
print*, xtest, ' outside range'
else if ( (xtest - xx(j) ) .lt. (xx(j+1) - xtest) ) then
print*, xtest, ' nearest grid:', j, ' at ', xx(j)
else if ( (xtest - xx(j)) .gt. (xx(j+1) - xtest) ) then
print*, xtest, ' nearest grid:', j+1, ' at ', xx(j+1)
else
print*, xtest, ' at midpoint'
end if
end do
end program main
|
[/quote] |
|
| Back to top |
|
|
DanRRight
Joined: 10 Mar 2008
Posts: 2816
Location: South Pole, Antarctica
|
| Posted: Tue May 19, 2020 4:15 pm Post subject: |
|
|
Paul,
With your last example if modify x_max, y_max arbitrary way (not coinciding with the plotting data which ends at 1 in your example) how to get pixel (ix, iy) coordinated of each axis?
Things are it is often necessary to place something on axis or exactly nearby but the plotting program modifies user defined x_max and y_max (as well as x_min, y_min) to nearest nice looking for human eye numbers. As a result if i set x_max=1.29 the axis will be at 1.4 but if change dx it will be every time at different nice looking point. We never know which xy point this will be
Here is your example modified to show what i mean. Is there a way for example to place small rectangle DRAW_RECTANGLE@(ixx,iyy,ixxx,iyyy, icolor) exactly on both X an Y axis right top corner ?
Another question - i guess how in my example below the x axis title and numbering appears below the bottom x axis (like it should be in most of cases )? In my own other programs it appear in the middle x axis overwritten by the plotting points and i can not guess what causes this  ? ?
Note also that axis titles now are not perfectly centered in the middle of each axis but in the middle of only positive part of axis
| Code: | MODULE plData
USE clrwin
INTEGER(7) hwnd
CONTAINS
INTEGER FUNCTION cb()
CHARACTER(80) status,reason
DOUBLE PRECISION x,y
reason = clearwin_string@("CALLBACK_REASON")
IF(reason == "MOUSE_MOVE")THEN
ix = clearwin_info@("GRAPHICS_MOUSE_X")
iy = clearwin_info@("GRAPHICS_MOUSE_Y")
i = get_plot_data@(ix,iy,x,y)
status = " "
IF(x >= 0d0 .AND. y >= 0d0 .AND. x <= 1d0 .AND. y <= 1d0)THEN
write(status,"(a,i3,a,i3,a)") ' Point(',ix,',',iy,')'
CALL set_status_text@(hwnd,0,status)
write(status,"(a,f6.2,a,f6.2,a)") ' Value(',x,',',y,')'
ELSE
CALL set_status_text@(hwnd,0,status)
ENDIF
CALL set_status_text@(hwnd,1,status)
ENDIF
cb = 2
END FUNCTION
END MODULE plData
!---------------------------------------------------------------------------------------
PROGRAM main
USE plData
INTEGER,PARAMETER:: N=11,M=2
DOUBLE PRECISION x(N),y(N)
INTEGER i,sbparts(M)
DATA sbparts /26,-1/
DO i=1,N
x(i)=0.1d0*(i-1)
y(i)=x(i)*x(i)
ENDDO
i = winio@('%ww%ca[ClearWin+]&')
i = winio@('%bg[BTNFACE]&')
CALL winop@("%pl[title=Quadratic]")
CALL winop@("%pl[width=2]")
CALL winop@("%pl[x_array]")
CALL winop@("%pl[link=curves]")
CALL winop@("%pl[symbol=9]")
CALL winop@("%pl[colour=red]")
CALL winop@("%pl[pen_style=2]")
CALL winop@("%pl[frame,gridlines]")
CALL winop@("%pl[y_sigfigs=2]")
CALL winop@("%pl[x_axis=X-data]")
CALL winop@("%pl[y_axis=Y-data]")
CALL winop@("%pl[x_min=-0.66]")
CALL winop@("%pl[x_max=1.36]")
CALL winop@("%pl[y_min=-0.77]")
CALL winop@("%pl[y_max=1.37]")
CALL winop@("%pl[dx=0.2]")
CALL winop@("%pl[dy=0.2]")
CALL winop@("%pl[full_mouse_input]")
i=winio@('%`bg[white]&')
i=winio@('%`*sb%lc&', M, sbparts, hwnd)
i=winio@('%`bg&',RGB@(252,252,252))
i=winio@('%pv%^pl',600,400,N,x,y,cb)
END PROGRAM |
Last edited by DanRRight on Tue May 19, 2020 4:49 pm; edited 1 time in total |
|
| Back to top |
|
|
Martin_K
Joined: 09 Apr 2020
Posts: 227
|
| Posted: Tue May 19, 2020 4:46 pm Post subject: |
|
|
Ken,
thanks for your tips!
I still have some formal questions to your last two responses, since i did not found it on the on-line help:
Q1:
| Code: |
i = COPY_GRAPHICS_REGION@(handle_internal_gr, 1, 1, gw, gh, handle_pl, 1, 1, gw, gh, 13369376 )
|
What is the real meaning of the numeric arguments 1,1 ... 1,1 ... 13369376 in the code above?
Q2:
In your last reply you used the NR abbreviation. I suppose it stands for NUMERICAL RECIPES. When I am right, are these NR somewhere on the web available for download free of charge or all NR are a payed option?
Thanks for your answers in advance! |
|
| Back to top |
|
|
PaulLaidler
Site Admin
Joined: 21 Feb 2005
Posts: 7925
Location: Salford, UK
|
| Posted: Tue May 19, 2020 5:18 pm Post subject: |
|
|
Dan
Sometimes using a larger font causes the captions to be overwritten by the tick values. In which case there is an offset mechanism to adjust the position of a caption.
ir = GET_PLOT_POINT@(0.0d0, 0.0d0, xpix,ypix)
gives the pixel coordinates of the origin as double precision values. |
|
| Back to top |
|
|
PaulLaidler
Site Admin
Joined: 21 Feb 2005
Posts: 7925
Location: Salford, UK
|
| Posted: Tue May 19, 2020 5:25 pm Post subject: |
|
|
Martin
Ken will be able to answer Q2.
For Q1, ff you are using Plato then type the name of the routine, place the caret at any point in the name and press F1.
Otherwise open FTN95.chm, and use the search facility. |
|
| Back to top |
|
|
Kenneth_Smith
Joined: 18 May 2012
Posts: 697
Location: Hamilton, Lanarkshire, Scotland.
|
| Posted: Tue May 19, 2020 5:50 pm Post subject: |
|
|
Q1
https://www.silverfrost.com/ftn95-help/clearwinp/library/copy_graphics_region_.aspx
Q2
http://numerical.recipes/com/storefront.html
Some snippets of NR code can be found using a search engine.
There may be some alternatives to NR and perhaps I am guilty of thinking about programming using the FTN77 techniques I was taught in 1984 rather than ftn95 in 2020. (Not true since I no longer use common blocks!)
The code below does more or less the same job as that I previously posted.
| Code: | program main
implicit none
real*8 xx(1:10), xtest
integer i,j
do i = 1, 10, 1
xx(i) = dble(i)
end do
do i = 1,20, 1
xtest = 10.d0*random@()
j = minloc(abs(xx - xtest), 1)
print*, xtest, j
end do
end program main
|
|
|
| Back to top |
|
|
DanRRight
Joined: 10 Mar 2008
Posts: 2816
Location: South Pole, Antarctica
|
| Posted: Tue May 19, 2020 11:45 pm Post subject: Re: |
|
|
| PaulLaidler wrote: | Dan
Sometimes using a larger font causes the captions to be overwritten by the tick values. In which case there is an offset mechanism to adjust the position of a caption.
ir = GET_PLOT_POINT@(0.0d0, 0.0d0, xpix,ypix)
gives the pixel coordinates of the origin as double precision values. |
1) No, i asked about different thing. In your example the axis origin coincides with the data origin just by chance, in general case the numbering mechanism changes it at will. Here is how plot from your example above looks where i just moved position of axis. How to find the exact (ix, iy) or (x,y) positions of axis corners (marked in magenta)? Without knowing that user can not add anything to the plot using Clearwin graphics library like draw_line@, draw_characters, draw_ellipse@ etc
2) You can see the axis text is not centered and is too close to numbers despite your font has minimal size and is just 1 pixel thick. (BTW, on the 4k monitor i just do not see anything - this is how small the plot is and specifically how small numbers are and i plan to switch to 8k !!!)
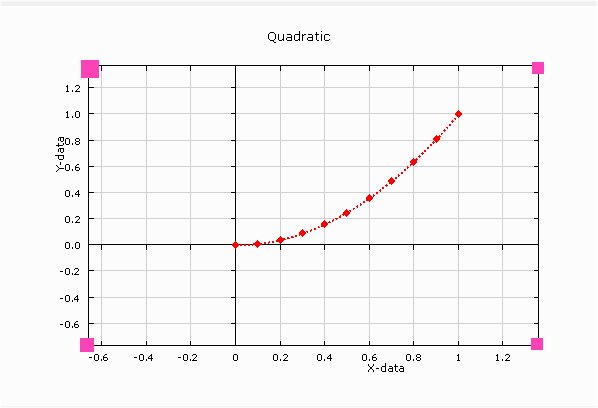
3) How to make X axis numbering and X axis name not to be overwritten by the data? In your example numbering placed in the bottom axis, in my case in the middle - which is definitely wrong way to do - and i do not understand why and how to change that
 |
|
| Back to top |
|
|
PaulLaidler
Site Admin
Joined: 21 Feb 2005
Posts: 7925
Location: Salford, UK
|
| Posted: Wed May 20, 2020 8:22 am Post subject: |
|
|
Dan
1) I am not sure about the easiest and best way to do this. Maybe I should provide a routine that gives you the data values for the grid corners and maybe other things that users need.
2) I don't have an answer to this issue except to say that, at the moment as a user, you can either adjust the position of the caption or tell ClearWin+ not to draw them and then draw them directly in a startup callback. Here are some details from the help file..
| Quote: | 1. If ClearWin+ draws a title or axis caption at an inappropriate point then its position can be adjusted. For example [title=My Graph@(4.8)] using a decimal point, draws "My Graph" at a point that is adjusted 4 pixels to the right and 8 pixels down from its default position.
2. If an axis caption is not supplied then the defaults are lower case "x" and "y". Setting [x-axis=@] or [y-axis=@] prevents ClearWin+ from drawing the caption which could then be drawn using a callback function.
|
|
|
| Back to top |
|
|
Kenneth_Smith
Joined: 18 May 2012
Posts: 697
Location: Hamilton, Lanarkshire, Scotland.
|
| Posted: Wed May 20, 2020 11:39 am Post subject: |
|
|
Dan,
Try %pl[frame]. This was one of the first additions Paul made to the new %pl.
You can define the position of the frame using the margin option. If you don't specify the margins then it's more challenging. That's where the possible new routine Paul has suggested comes in.
Ken |
|
| Back to top |
|
|
Kenneth_Smith
Joined: 18 May 2012
Posts: 697
Location: Hamilton, Lanarkshire, Scotland.
|
| Posted: Wed May 20, 2020 12:39 pm Post subject: |
|
|
Dan,
Example for you.
| Code: | module example
use clrwin
implicit none
integer, parameter :: dp = kind(1.d0)
real(kind=dp) :: x_data(1:20), y_data(1:20)
integer :: gw = 800, gh=600
contains
integer function generate_data()
integer i
do i = 1, 20
x_data(i) = random@()
y_data(i) = random@()
end do
x_data = x_data - 0.5d0
y_data = y_data - 0.5d0
generate_data = 2
end function generate_data
integer function plot()
integer, save :: iw
call winop@('%pl[independent,x_array,link=none,symbol=6,gridlines,frame,margin=(100,100,100,100)]')
iw = winio@('%^pl&',gw,gh,20,x_data,y_data, draw_border)
iw = winio@(' ')
plot =2
end function plot
integer function draw_border()
call draw_rectangle@(100,100,gw-100,gh-100,rgb@(255,0,0))
draw_border =2
end function draw_border
end module example |
|
|
| Back to top |
|
|
DanRRight
Joined: 10 Mar 2008
Posts: 2816
Location: South Pole, Antarctica
|
| Posted: Wed May 20, 2020 9:52 pm Post subject: |
|
|
Thanks Paul and Ken,
Have not noticed your "frame" which is not the same as my used "framed"
Is there a way to set the margin just for one specific (right, for example) axis? Then i will not change anything else in existing code (specifically not remove the pivot %pv to resize the plot with the mouse) and will know exactly the pixel position of the right axis while leaving pivot operational. I probably can do my own resizing with any arbitrary margin=(ix,iy,iz,it) but that will bend the idea of %pl to be a simple plotting utility into more complex territory
Paul, the additional function to know X and Y axis position which %pl chose as "nice numbers" instead of user defined x_min/x_max and y_min/y_max would be very nice. Without that whenever i plot anything on top of %pl, its position relative to any axis permanently changes with changing of plotted data and with pivot resize. Plotting mentioned above user own axis names, tics and captions
| PaulLaidler wrote: |
2. If an axis caption is not supplied then the defaults are lower case "x" and "y". Setting [x-axis=@] or [y-axis=@] prevents ClearWin+ from drawing the caption which could then be drawn using a callback function.
|
without such function is essentially impossible, the position relative to axis will permanently change
As to the
| PaulLaidler wrote: |
1. If ClearWin+ draws a title or axis caption at an inappropriate point then its position can be adjusted. For example [title=My Graph@(4. ] using a decimal point, draws "My Graph" at a point that is adjusted 4 pixels to the right and 8 pixels down from its default position. ] using a decimal point, draws "My Graph" at a point that is adjusted 4 pixels to the right and 8 pixels down from its default position. |
i think that no one will ever object to set the default position of X and Y axis names at the center of axis. As a proof i made Google search images for "scientific graphs" and among numerous plots on the first page have not noticed any with not centered axis names |
|
| Back to top |
|
|
|
|
You cannot post new topics in this forum
You cannot reply to topics in this forum
You cannot edit your posts in this forum
You cannot delete your posts in this forum
You cannot vote in polls in this forum
|
Powered by phpBB © 2001, 2005 phpBB Group
|

