 |
forums.silverfrost.com
Welcome to the Silverfrost forums
|
| View previous topic :: View next topic |
| Author |
Message |
FK_GER
Joined: 26 Oct 2017
Posts: 35
Location: University of Kassel,Germany
|
 Posted: Fri Sep 14, 2018 4:11 pm Post subject: Assistance in updating a window Posted: Fri Sep 14, 2018 4:11 pm Post subject: Assistance in updating a window |
 |
|
I've some problems to update an attached window. I've searched in the forum but I found no suitable help. Here, at first, the relevant part of my program:
(All data is declared correctly and available)
| Code: | [color=green]
Main program
...
...
! open MDI-window
i=winio@('%sp&',winx,winy)
i=winio@('%pv%`fr&',winb,winh,ctrl0)
i=winio@('%ca[Darstellung der Berechnungsergebnisse]&')
i=winio@('%hw&',hand0)
i=winio@('%lw[owned]',ctrl_mdi)[/color]
!!!STEP a. plot-data is produced in several subroutines
!!!STEP b. drawing-subroutine is called
SUBROUTINE BI_EI_GI (xdata,ydata,ist,nou)
INCLUDE <windows.ins>
REAL*8 xData(NWDIM,KU),yData(NWDIM,KU) ! KU data sets
REAL*8 winkel
! declare x-y-data for plotting legend and labels
....
....
CALL winop@("%pl[y_min=0.,y_max=1.]")
CALL winop@("%pl[x_min=0.,x_max=0.5]")
CALL winop@("%pl[dy=0.1]")
CALL winop@("%pl[n_graphs=2]")
CALL winop@("%pl[width=2,width=2]")
CALL winop@("%pl[pen_style=0,pen_style=2]")
CALL winop@("%pl[link=lines,link=curves]")
CALL winop@("%pl[colour=red,colour=blue]")
CALL winop@("%pl[symbol_size=2,symbol_size=2]")
CALL winop@("%pl[symbol=0,symbol=11]")
CALL winop@("%pl[gridlines]")
CALL winop@("%pl[x_array]")
!c---Display a window containing the graph.
IF (NOU .EQ. 1) iw0=winio@('%sp&',plox,ployo) !!upper window
IF (NOU .EQ. 2) iw0=winio@('%sp&',plox,ployu) !!lower window
iw0=winio@('%pv%aw&',ctrl_mdi)
iw0=winio@('%ww[no_border]&')
iw0=winio@('%`bg[white]&')
iw0=winio@('%ca@&',USCH(1:LEN_TRIM(USCH)))
iw0=winio@('%pl',plopix,plopiy,ist, &
xData(1:ist,1),yData(1:ist,1),yData(1:ist,2))
CALL draw_characters@(txrt(1:lrt),ihkr,ivv0,RGB@(255,0,0)) !legend
CALL draw_characters@(txbl(1:lbl),ihkb,ivv0,RGB@(0,0,255)) !legend
CALL draw_characters@(titl(NOU)(1:lt),ihlt,ivv1,RGB@(0,0,0)) !plot-title
CALL draw_characters@(x_tex(1:lxx),ihxax,ivxax,RGB@(0,0,0)) !label x-axis
CALL rotate_font@(winkel)
CALL draw_characters@(y_tex(1:lyy),ihyax,ivyax,RGB@(0,0,0)) !label y-axis
RETURN
end subroutine BI_EI_GI
!!!STEP c. new plot-data is created and back to step b. , until limit of iteration is reached [/color]
|
The program works as desired. Within the mdi-frame two attached windows (upper and lower) show the drawing. But by this course new windows are opened at each call of the subroutine BI_EI_GI. Therefore, at the end of the iteration a lot of windows lay on the screen one upon the other accurately, sometimes 2x20 and more.
A control (iw0=winio@('%lw',ctrl_eiz) or a handle (iw0=winio@('%hw',hndl_eiz) of the current window create both a child-window, which stops the flow.
The aim is, that after the first call of BI_EI_GI the window is updated and not created newly.
What have I to do? |
|
| Back to top |
|
 |
Wilfried Linder
Joined: 14 Nov 2007
Posts: 314
Location: D�sseldorf, Germany
|
| Posted: Fri Sep 14, 2018 4:49 pm Post subject: |
|
|
Hi, I found the following information in the file cwplus.enh:
| Quote: | | The arrays of data supplied to %PL should continue to be available for as long as the window is displayed. In particular, the data will be re-plotted if the window is re-sized. It is also possible to call the routine SIMPLEPLOT_REDRAW@ to force all such plots to be re-drawn using whatever values are currently present in the arrays. |
Perhaps you should create the %pl window once (outside BI_EI_GI) and use only SIMPLEPLOT_REDRAW@ within the subroutine? |
|
| Back to top |
|
|
John-Silver

Joined: 30 Jul 2013
Posts: 1520
Location: Aerospace Valley
|
| Posted: Sun Sep 16, 2018 7:23 pm Post subject: |
|
|
.... noting that for LOG scales it's now PLOT_REDRAW@ which should be used
see: http://forums.silverfrost.com/viewtopic.php?t=3487&postdays=0&postorder=asc&start=375
Paul's comments on 29th June & 30th June which implies that is in the v8.3beta279 dlls.
Also note in:
(Link corrected as 18_09_2018) !)
https://silverfrost.com/ftn95-help/clearwinp/simplepl/native.aspx
in the section starting: "The drawing of a graph can be delayed in one of three alternative ways: ..."
the procedure mentioned there.
and in 'Additional Notes' point 3 which talks about using %`PL to use a user-specified identifier for particular %pl's (so you can work with more than one if you like)you mention in your post you have x 2 ?)
And the EXAMPLE 2 there is worth studying as it brings several of these things into play.
____________________-
PAUL - just a quick question, where �s the %`PL format documented ? (i.e. where do you put the identifier you want in the %`pl statement?)
(I assume it will eventually be put here: http://www.silverfrost.com/ftn95-help/clearwinp/formats/_pl.aspx )
PS1 - in that link just given I noticed the qualifier (?) listed, but with no description - what does it do ?
PS2 - in the first documentation linked to earlier above it's probably wise to include an asterisk against all occurences of 'SIMPLEPLOT_REDRAW' to say that for log plots 'PLOT_REDRAW' should be used.
_________________
''Computers (HAL and MARVIN excepted) are incredibly rigid. They question nothing. Especially input data.Human beings are incredibly trusting of computers and don't check input data. Together cocking up even the simplest calculation ...  " "
Last edited by John-Silver on Tue Sep 18, 2018 5:37 am; edited 1 time in total |
|
| Back to top |
|
|
FK_GER
Joined: 26 Oct 2017
Posts: 35
Location: University of Kassel,Germany
|
| Posted: Mon Sep 17, 2018 3:54 pm Post subject: |
|
|
The last days I've tested some possibilities to find a solution, but with no great success.
In doing so the subroutine was modified:
(k3 controls, if an update is to be done. At the first call k3=1, then 2,3,...)
| Code: |
SUBROUTINE BI_EI_GI (xdata,ydata,ist,k3,nou)
INCLUDE <windows.ins>
REAL*8 xData(NWDIM,KU),yData(NWDIM,KU) ! KU data sets
REAL*8 winkel
INTEGER hndl_eiz/1/,hndl_git/2/ !!handle for %`pl <---- NEW
!! update of plot-windows
IF (K3 .GT. 1 .AND. NOU .EQ. 1) THEN
call select_graphics_object@(hndl_eiz)
call simpleplot_redraw@()
return
ENDIF
IF (K3 .GT. 1 .AND. NOU .EQ. 2) THEN
call select_graphics_object@(hndl_git)
call simpleplot_redraw@()
return
ENDIF
!! no update, first windows are opened
CALL winop@ ..... declarations as shown before
.....
!c---Display a window containing the graph.
IF (NOU .EQ. 1) then
iw1=winio@('%sp&',plox,ployo) !!upper window
iw1=winio@('%pv%aw&',ctrl_mdi)
iw1=winio@('%ww[no_border]&')
iw1=winio@('%`bg[white]&')
iw1=winio@('%ca@&',USCH(1:LEN_TRIM(USCH)))
iw1=winio@('%`pl',plopix,plopiy,ist, &
xData(1:ist,1),yData(1:ist,1),yData(1:ist,2),hndl_eiz)
endif
IF (NOU .EQ. 2) then
iw2=winio@('%sp&',plox,ployu) !!lower window
iw2=winio@('%pv%aw&',ctrl_mdi)
iw2=winio@('%ww[no_border]&')
iw2=winio@('%`bg[white]&')
iw2=winio@('%ca@&',USCH(1:LEN_TRIM(USCH)))
iw2=winio@('%`pl',plopix,plopiy,ist, &
xData(1:ist,1),yData(1:ist,1),yData(1:ist,2),hndl_git)
endif
! declare x-y-data for plotting legend and labels
....
....
CALL draw_characters@ .... like shown before
RETURN
end subroutine BI_EI_GI
|
The following error occurs:
Run-time Error
Invalid data value supplied to %PL
BI_EI_GI - in file bi_ei_gi_wr2.f90 at line 46 [+0232] (the line "call simpleplot_redraw@()")
FLAPLO - in file flaplo.for at line 131 [+4553]
This error is incomprehensibly, because the new data (xdata,ydata) is produced in the calling routine FLAPLO and transferred with the list to BI_EI_GI.
It's strange, that the error is done at the call of the upper window (NOU=1), but on the screen the lower window is cleared simultaneously. ???
A test with "plot_redraw()" instead of "simpleplot_redraw()" produces a linker error: "file not found". A new library is needed (Beta279), but this could be precariously for the other parts my program.
To show about what we discussed, here the plot, which is produced with BI_EI_GI:
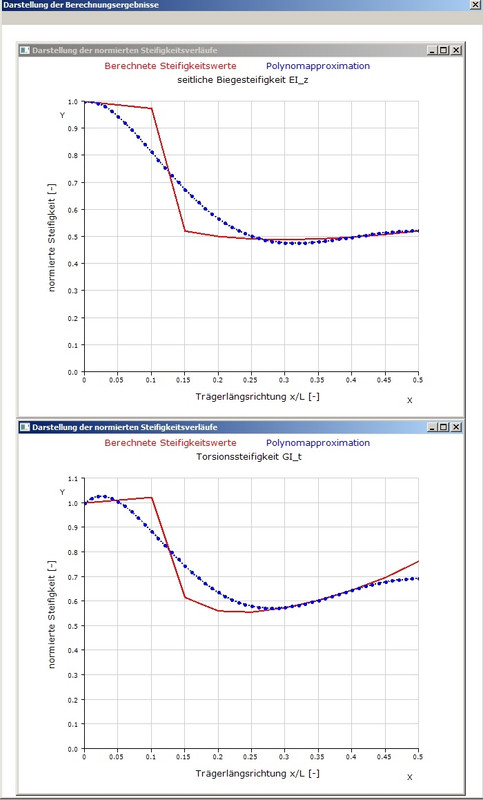
Only the title and the red and blue curves are varied and should be updated step by step. But in one step both windows are changed, at first the upper, then the lower.
The red curve shows the course of the calculation done with material specifications as a polygon, the blue the approximation as a polynom. |
|
| Back to top |
|
|
JohnCampbell
Joined: 16 Feb 2006
Posts: 2556
Location: Sydney
|
| Posted: Tue Sep 18, 2018 4:53 am Post subject: |
|
|
I am by no means an expert in %pl, but I am unsure of your selection (and definition) of the 2 windows you are using and the separate definition of arrays for each window.
If you are updating windows, are the variables ist, xdata and ydata different and unique to the 2 windows ?
I would expect that to have 2 widows that you are updating, then the %pl argument addresses must be separate/unique for the 2 windows and these addresses must be maintained for each window.
Could window_update@ (xdata) or update_window@(hndl_eiz) work better.
I assume hndl_eiz are supplied integer*4 handles and not returned integer(7) handles ?
Is the following change necessary (or where are the graphics objects defined) ?
| Code: | !c---Display a window containing the graph.
IF (NOU .EQ. 1) then
call select_graphics_object@(hndl_eiz)
iw1=winio@('%sp&',plox,ployo) !!upper window
iw1=winio@('%pv%aw&',ctrl_mdi)
iw1=winio@('%ww[no_border]&')
iw1=winio@('%`bg[white]&')
iw1=winio@('%ca@&',USCH(1:LEN_TRIM(USCH)))
iw1=winio@('%`pl',plopix,plopiy,ist, &
xData(1:ist,1),yData(1:ist,1),yData(1:ist,2),hndl_eiz)
endif
IF (NOU .EQ. 2) then
call select_graphics_object@(hndl_git) !
iw2=winio@('%sp&',plox,ployu) !!lower window
iw2=winio@('%pv%aw&',ctrl_mdi)
iw2=winio@('%ww[no_border]&')
iw2=winio@('%`bg[white]&')
iw2=winio@('%ca@&',USCH(1:LEN_TRIM(USCH)))
iw2=winio@('%`pl',plopix,plopiy,ist, &
xData(1:ist,1),yData(1:ist,1),yData(1:ist,2),hndl_git)
endif |
|
|
| Back to top |
|
|
John-Silver
Joined: 30 Jul 2013
Posts: 1520
Location: Aerospace Valley
|
| Posted: Tue Sep 18, 2018 5:49 am Post subject: |
|
|
I'mnot sure how the %pl handles are created, which is why Iasked the question of Paul in my comment above of where the documentation of the grave qualifier for %pl is located.
Note also I've corrected one of the links in my previous comment.
Read the section starting 'The following functions can be called after a window has been formed in order to change the data. ' to see the use of the CHANGE_PLOT_DBL@ function and xample 2 for an application.
Then try inserting something like:
errstate = change_plot_dbl@(hndl_eiz,"x_data",all_graphs,xdata(1:ist,1))
errstate = change_plot_dbl@(hndl_eiz,"y_data",all_graphs,ydata(1:ist,1))
... and similarly for hndl_git ...
before the calls to simpleplot_redraw
On the error you're getting- I know it shouldn't make a difference if case insensitive, but in the CALL arguments list you have sdata and ydata but in the program you have xData and yData
_________________
''Computers (HAL and MARVIN excepted) are incredibly rigid. They question nothing. Especially input data.Human beings are incredibly trusting of computers and don't check input data. Together cocking up even the simplest calculation ... " |
|
| Back to top |
|
|
John-Silver
Joined: 30 Jul 2013
Posts: 1520
Location: Aerospace Valley
|
| Posted: Tue Sep 18, 2018 6:30 am Post subject: |
|
|
Just a thought but I've just noticed that your handles variables are local to the subroutine.
Could this be affecting things as when you continually reenter the subroutine your trying to select a graphic object with that handle but what is ut's value on reentry - is it saved or does it go to zero or worse to gobbledygook ? (I'd love to know what the german word for gobbledygook is ! )
I'd have thought best to wsett up the windows first time round in a seperate routine. And pass all these variables globally vi a module , or at least via the subroutine parameter list?
_________________
''Computers (HAL and MARVIN excepted) are incredibly rigid. They question nothing. Especially input data.Human beings are incredibly trusting of computers and don't check input data. Together cocking up even the simplest calculation ... " |
|
| Back to top |
|
|
FK_GER
Joined: 26 Oct 2017
Posts: 35
Location: University of Kassel,Germany
|
| Posted: Wed Sep 19, 2018 4:43 pm Post subject: |
|
|
From your replies I recognize, that still some more explanations are necessary about the process of drawing.
If inside of the higher-level iteration process the program turns up to the drawing part, the calling subroutine FLAPLO sets the calculated data XZZ,YZZ to REAL*8 XPLOT,YPLOT for plotting as follows:
| Code: |
SUBROUTINE FLAPLO (..,K3,..
...
COMMON /DIMX/ KU, ... ,NWDIM
REAL*8 XPLOT(NWDIM,KU),YPLOT(NWDIM,KU)
....
!!! step for upper window eiz (NOU=1)
DO I=1,ist1
XPLOT(I,1) = XZZ(I,1)*1.D0
YPLOT(I,1) = YZZ(I,1)*1.D0
YPLOT(I,2) = YZZ(I,2)*1.D0
ENDDO
CALL BI_EI_GI (xplot,yplot,ist1,K3,1)
!!! step for lower window git (NOU=2)
DO I=1,ist2
XPLOT(I,1) = XZZ(I,3)*1.D0
YPLOT(I,1) = YZZ(I,3)*1.D0
YPLOT(I,2) = YZZ(I,4)*1.D0
ENDDO
CALL BI_EI_GI (xplot,yplot,ist2,K3,2)
RETURN
END
|
At each call of "FLAPLO" these two plots has to be done.
At the first call, K3 has the value 1 and in that case only the code, which JohnCampbell has mentioned, is executed with all needed settings. In this process with the code "iw1=winio@('%`pl', ... ,hndl_eiz)", respectively iw2=winio@('%`pl', ... ,hndl_git) an access point to the particular plot the should be created, remembering that the hndl-values are [input] for %`pl. Anyway I hope this.
At the second call, K3 has the value 2,3,... and in that cases the updates are be done, always for the upper and the lower window. Therefore at the start of BI_EI_GI the IF-statements "IF (K3 .GT. 1 ... ) shall manage that. Insofar my wish, but until now unsuccessful!
As recommended I've tried
errstate = change_plot_dbl@(hndl_eiz,"x_data",all_graphs,xData(1:ist,1))
errstate = change_plot_dbl@(hndl_eiz,"y_data",all_graphs,yData(1:ist,1))
errstate = change_plot_dbl@(hndl_eiz,"y_data",all_graphs,yData(1:ist,2))
call simpleplot_redraw@()
and get the runtime-error
*** Error 112, Reference to undefined variable, array element or function result (/UNDEF)
at the first errstate-call.
I don't understand this error, because the xData is available. It's transferred over the list from FLAPLO to BE_EI_GI. The relevant data is printed on the control-window. I'm perplexed and don't know where to find the correct hints. A paradigm may be helpfully.
At least "gobbledygook" is a funny expression. In german that is to say "Kauderwelsch", what means that someone is speaking chinese and nobody is able to understand the words. |
|
| Back to top |
|
|
Wilfried Linder
Joined: 14 Nov 2007
Posts: 314
Location: D�sseldorf, Germany
|
| Posted: Thu Sep 20, 2018 2:41 pm Post subject: |
|
|
I'm not familiar with %pl but from a theoretical point of view I would suggest the following:
[1] Define a set of variables for both plots, like XPLOT_1 and YPLOT_1 for the first graphics, XPLOT_2 and YPLOT_2 for the second. Initialise them at the beginning to zero.
[2] Make the data transfer via a common block like COMMON /PL_DATA/ XPLOT_1,YPLOT_1,XPLOT_2,YPLOT_2 (instead of transferring them via the variables list of the subroutines).
In this way, you don't need handles nor select_graphics-object@() or similar, and also you make sure that all relevant data are present when calling simpleplot_redraw@().
Good luck! |
|
| Back to top |
|
|
Wilfried Linder
Joined: 14 Nov 2007
Posts: 314
Location: D�sseldorf, Germany
|
| Posted: Thu Sep 20, 2018 4:04 pm Post subject: |
|
|
Just to illustrate what I mean - a very small test programme, my first attempt with %pl 
| Code: | program plot_test
winapp
external abc
integer*4 i
real*8 xplot_1(100),yplot_11(100),yplot_12(100),xplot_2(100),yplot_21(100),yplot_22(100)
common /pl_data/ xplot_1,yplot_11,yplot_12,xplot_2,yplot_21,yplot_22
! initialise values
xplot_1 = 0.D0
xplot_2 = 0.D0
yplot_11 = 0.D0
yplot_12 = 0.D0
yplot_21 = 0.D0
yplot_22 = 0.D0
! create plot window, connect it with call-back function abc
i = winio@('%ca[Simpleplot, zwei unabh�ngige Grafiken]%sc%pv&',abc)
i = winio@('%pl[x_axis=Tr�gerl�ngsrichtung,y_axis=Steifigkeit,n_graphs=2,y_min=0,y_max=2,colour=red,'&
//'colour=blue,x_array]&',300,300,100,xplot_1,yplot_11,yplot_12)
i = winio@('%pl[x_axis=Tr�gerl�ngsrichtung,y_axis=Steifigkeit,n_graphs=2,y_min=0,y_max=2,colour=red,'&
//'colour=blue,x_array]',300,300,100,xplot_2,yplot_21,yplot_22)
end
integer function abc()
include <windows.ins>
integer*4 i,j
real*8 r,s
real*8 xplot_1(100),yplot_11(100),yplot_12(100),xplot_2(100),yplot_21(100),yplot_22(100)
common /pl_data/ xplot_1,yplot_11,yplot_12,xplot_2,yplot_21,yplot_22
! calculate data and refresh both graphics (for this demo I used the sleep@ function for
! a short delay between updating)
do j = 1,20
s = sqrt(dble(j))
do i = 1,100
xplot_1(i) = dble(i)/10.D0
xplot_2(i) = dble(i)/10.D0
r = s*dble(i)/100.D0
yplot_11(i) = sqrt(r)
yplot_12(i) = r*r
yplot_21(i) = abs(cos(r))
yplot_22(i) = abs(sin(r))
end do
call simpleplot_redraw@()
call sleep@(.25)
end do
abc = 1
end |
Please note that the code is written in the f95 free-format style and tested with FTN95, version 7.10.0 (32 bits). |
|
| Back to top |
|
|
FK_GER
Joined: 26 Oct 2017
Posts: 35
Location: University of Kassel,Germany
|
| Posted: Fri Sep 21, 2018 3:04 pm Post subject: |
|
|
Hi,Wilfried,
thanks for the example. But there are a lot of obstacles in order to transfer these procedures to my program:
- The creation of the plot-data is an expensive iteration process with a lot of subroutines, which couldn't be installed simply into a function like shown in the example.
- The predominant parts of the program source code is written in F77. All significant arrays, under it the plot arrays xplot(..,..) yplot(..,..), are dynamically dimensioned in the main program and transferred over the calling lists into the subroutines.
- These two plot arrays are used during the flow of the program from three subroutines with in their dimensions very different plot data to show the calculated results. To put these plot arrays into fixed dimensioned common-blocks would be meant, that than an own fixed common-block has to be created for each plot, instead of one array for all plots as now.
- A problem at your proposal is, that your program opens one window with two plots, which are updated. But my program opens two windows each with one plot, which should be updated one after another. In doing so I suppose problems with the allocation.
Seeing that the program works without an "updating-windows" process, the operating expence to realise these update process like your proposal is too great. Then the results will shown in multiple windows still and not in one window only. The program user don't notice that, because the windows lie on top of each other exactly.
Maybe a way will be found to realise an update process, which matches to my actual procedure. |
|
| Back to top |
|
|
Wilfried Linder
Joined: 14 Nov 2007
Posts: 314
Location: D�sseldorf, Germany
|
| Posted: Fri Sep 21, 2018 5:08 pm Post subject: |
|
|
OK.
Two windows with each one plot is no problem. For variable dimensions of the arrays you may use a module. Below is my next example, first the module, then the main program, the rest given as subroutines. Now written in the traditional f77 fixed format.
Perhaps this can help a little bit. If you like you may contact me via wilfried.linder@uni-duesseldorf.de - this might be easier for larger code examples.
| Code: | module pl_arrays
c allocatable plot arrays, dimension, ctrl needed for %lw
integer*4 arr_dim,ctrl
real*8,allocatable::xplot_1(:)
real*8,allocatable::yplot_11(:)
real*8,allocatable::yplot_12(:)
real*8,allocatable::xplot_2(:)
real*8,allocatable::yplot_21(:)
real*8,allocatable::yplot_22(:)
end
C ====================================================================== CCCC
program plot_test
winapp
use pl_arrays
integer*4 errcode
c allocate arrays with the size you need (arr_dim)
arr_dim = 100
allocate(xplot_1(arr_dim),stat=errcode)
allocate(yplot_11(arr_dim),stat=errcode)
allocate(yplot_12(arr_dim),stat=errcode)
allocate(xplot_2(arr_dim),stat=errcode)
allocate(yplot_21(arr_dim),stat=errcode)
allocate(yplot_22(arr_dim),stat=errcode)
c initialise values
xplot_1 = 0.D0
xplot_2 = 0.D0
yplot_11 = 0.D0
yplot_12 = 0.D0
yplot_21 = 0.D0
yplot_22 = 0.D0
c create plot windows, start plotting
call pl_window_1()
call pl_window_2()
call abc()
c deallocate arrays
deallocate(xplot_1)
deallocate(yplot_11)
deallocate(yplot_12)
deallocate(xplot_2)
deallocate(yplot_21)
deallocate(yplot_22)
c finally close windows
ctrl = 0
call window_update@(ctrl)
end
C ====================================================================== CCCC
subroutine pl_window_1()
use pl_arrays
integer*4 i
i = winio@('%ca[Simpleplot, Fenster 1]%sp%lw%pv&',200,1,ctrl)
i = winio@('%pl[x_axis=Tr�gerl�ngsrichtung,y_axis=Steifigkeit,'
* //'n_graphs=2,y_min=0,y_max=2,colour=red,colour=blue,'
* //'x_array]',300,300,arr_dim,xplot_1,yplot_11,yplot_12)
end
subroutine pl_window_2()
use pl_arrays
integer*4 i
i = winio@('%ca[Simpleplot, Fenster 2]%sp%lw%pv&',200,351,ctrl)
i = winio@('%pl[x_axis=Tr�gerl�ngsrichtung,y_axis=Steifigkeit,'
* //'n_graphs=2,y_min=0,y_max=2,colour=red,colour=blue,'
* //'x_array]',300,300,arr_dim,xplot_2,yplot_21,yplot_22)
end
C ====================================================================== CCCC
subroutine abc()
use pl_arrays
include <windows.ins>
integer*4 i,j
real*8 r,s
c calculate data and refresh both graphics (for this demo I used the
c sleep@ function for a short delay between updating)
do j = 1,20
s = sqrt(dble(j))
do i = 1,arr_dim
xplot_1(i) = dble(i)/10.D0
xplot_2(i) = dble(i)/10.D0
r = s*dble(i)/100.D0
yplot_11(i) = sqrt(r)
yplot_12(i) = r*r
yplot_21(i) = abs(cos(r))
yplot_22(i) = abs(sin(r))
end do
call simpleplot_redraw@()
call sleep@(.25)
end do
end |
Last edited by Wilfried Linder on Sat Sep 22, 2018 7:00 am; edited 1 time in total |
|
| Back to top |
|
|
Wilfried Linder
Joined: 14 Nov 2007
Posts: 314
Location: D�sseldorf, Germany
|
| Posted: Fri Sep 21, 2018 5:21 pm Post subject: |
|
|
Some additional remarks:
Both windows in the example before are created once. The calculation subroutine abc only updates the graphics but creates no new windows.
I think that simpleplot_redraw@() needs the array data to be present either in common blocks or in modules, but they cannot be transferred via the parameter list. I may be wrong... |
|
| Back to top |
|
|
Wilfried Linder
Joined: 14 Nov 2007
Posts: 314
Location: D�sseldorf, Germany
|
| Posted: Sat Sep 22, 2018 6:52 am Post subject: |
|
|
Next addition:
In my examples, I use one-dimensional arrays (xplot_1,yplot_11,yplot_12,...). Now I tried to use two-dimensional arrays like you, and then got the error message "Invalid data value supplied to %PL" - exactly what you wrote on Monday 17.09., post from 3:54, marked in red.
So, it seems that %pl can only handle one-dimensional arrays.
Have a nice weekend
Wilfried |
|
| Back to top |
|
|
John-Silver
Joined: 30 Jul 2013
Posts: 1520
Location: Aerospace Valley
|
| Posted: Sat Sep 22, 2018 9:59 am Post subject: |
|
|
FK_GER.
I see from the sections of code you've posted so far that:-
FLAPLO contains a common block, which includes the indices of the sub-array used in the subroutine BI_EI_GI
... BUT ... The COMMON block doesn't appear in the subroutine !
In BI_EI_GI (and FLAPLO) the full arrays are passed in the parameter list, but only declared within the range (NWDIM,KU) . Is this a potential problem ?
What version number of ftn95 are you using exactly ?
P.S. almost forgot, the phrase you gave as an equivalent of gobbledygook - as it's relaed to language the english equivalent would be closer to 'Double Dutch' i.e. twice as difficult as Dutch is for english people, or 2x impossible to understand ! as in " I heard what he said but it was all double dutch to me" Gobbledygook can relate to many things, not just language as in: "C or C++ is complete gobbledygook to most Fortran users"
_________________
''Computers (HAL and MARVIN excepted) are incredibly rigid. They question nothing. Especially input data.Human beings are incredibly trusting of computers and don't check input data. Together cocking up even the simplest calculation ... " |
|
| Back to top |
|
|
|
|
You cannot post new topics in this forum
You cannot reply to topics in this forum
You cannot edit your posts in this forum
You cannot delete your posts in this forum
You cannot vote in polls in this forum
|
Powered by phpBB © 2001, 2005 phpBB Group
|

