 |
forums.silverfrost.com
Welcome to the Silverfrost forums
|
| View previous topic :: View next topic |
| Author |
Message |
DanRRight
Joined: 10 Mar 2008
Posts: 2959
Location: South Pole, Antarctica
|
 Posted: Sat Feb 03, 2018 4:45 pm Post subject: Re: Posted: Sat Feb 03, 2018 4:45 pm Post subject: Re: |
 |
|
| PaulLaidler wrote: |
| However, when it comes to plotting graphs, is there any reason for having more than 7 significant figures in the data? If there is then %pl is not the thing to use. |
At first glance there is no reason even for more then 4 digits for plotting with all the screens currently are less then 10000x10000 pixels. And the only need to get more then 4 is to have color depth around 8 bits per color for which single precision is enough. Right? Even my own 2D graphics libraries all were single precision by the way by these exact reasons.
OpenGL though from start allowed both single and double precisions I had no idea what for and with time most pros who write the games switched to double precision. When Nvidia started using double precision i scratched my head! The graphics and video were slow, cards expensive, image barely displayed on a tiny windows, and they were making it even slower. 20 years ago I was really surprised why the heck they waste precious resources, degrade speed and double memory requirements. But decades later...remember me and Agustin strongly complained few years back at older %PL design defect for not taking double precision values?
The answer why all graphics utilities must be double precision is universality to accept wider range of input data which unfortunately spreads wildly causing the same damn crashes I hate so much from using spurious large or small numbers and denormals not in the single precision range. The cause of games crashes in the past (remember kids angry yelling?) very often was due to single precision engines. Single precision range became too narrow for broader use of graphics utilities! The same idea was behind the Intel FP processors with their 80 digits -- universality -- because there could easily exist some numerical methods written by any teenager which go to 10^4096 numbers and beyond while still the final result being plotted on 640x480 screen in 2 bits color!
Intel scaled down somewhat from 80bits recently, but at least it improved single and double precision speed making both almost the same. And SilverFrost got down from real*10 to real*8 in 64bit compiler and I now need to rewrite some parts of my code to different methods I did not have yet invented. I'm not asking for 80 digits, this is really rare opulence, but the life demands these 64 bits at least. Universality gives you less headache and much less crashes. Clearly, it is the native %PL which has internally handle interaction with Microsoft 32 bit system by scaling down from more universal 64 bits and take care of potential problems preventing crashes |
|
| Back to top |
|
 |
silicondale
Joined: 15 Mar 2007
Posts: 252
Location: Matlock, Derbyshire, UK
|
| Posted: Sun Feb 04, 2018 12:01 pm Post subject: |
|
|
John - I puzzled over the white space at the top in the 256-colours case, as well. But the explanation is quite simple. The plots represent x,y,value where the value is mapped to a colour. The data set is ordered by value, and mapped to colours so that there is (as far as possible) an equal number of points of each colour. In the 128-colour case all of the points are plotted as coloured squares. In the 256-colour case, the first half of the points map to colours 1 - 128. The second half of the points should map to colours 129 - 256 but in fact plot as black squiggles. Most of the high values are at the top of the plot. This plot shows sonar reflections and these are strongest at the top nearest to the sonar pinger. So what should plot as coloured squares near the top of the plot instead gets displayed as curved bezier lines all over the plot since the order of the x,y coordinates is completely arbitrary. You can see what happens in the 240-colour case where the higher values disappear and are replaced by curved lines.

Also showing the colour ramp - the only colours that ever get plotted are those in the left-hand half, blue to green.
I'm not sure why the lines in the 256 case don't go right to the top, but I guess by that stage the system has its knickers so twisted that the bezier curve fitting algorithm is itself struggling.
But why is the default setting black curved lines with no symbol ?
_________________
(Steve Henley) |
|
| Back to top |
|
|
DanRRight
Joined: 10 Mar 2008
Posts: 2959
Location: South Pole, Antarctica
|
| Posted: Sun Feb 04, 2018 9:14 pm Post subject: |
|
|
| Steve, Without demo I'm always puzzling what is done and what the problem is. Hopefully Paul gets that and will react. But if it looks like not many people are interested the solution may take longer time. In graphics typically always possible to make relatively small demo. |
|
| Back to top |
|
|
silicondale
Joined: 15 Mar 2007
Posts: 252
Location: Matlock, Derbyshire, UK
|
| Posted: Sun Feb 04, 2018 10:25 pm Post subject: |
|
|
John - we don't yet have the 255 limit version: I guess that will come with the next clrwin DLL release. I could do a 255 test but I think it will look very like the 256. Anyway, if I can use a 255-colour ramp instead of 256, not a basic problem. And I guess we have to accept Paul's statement that we are tied to some existing limitations in underlying code - at least for now. A matter of priorities, dependent on how many users want particular upgrades. It's the "art of the possible" and from my own viewpoint I am quite happy for now that Paul has been very responsive and helpful.
_________________
(Steve Henley) |
|
| Back to top |
|
|
silicondale
Joined: 15 Mar 2007
Posts: 252
Location: Matlock, Derbyshire, UK
|
| Posted: Tue Feb 06, 2018 10:00 am Post subject: |
|
|
Good point, John. And interesting results. It blows up ! Two plots from two runs of the same program, same parameters, both using 255 colours.

I ran the program several times. Got these two plots, but also two or three times it blew up or hung without producing any plot at all. I guess this is the sort of unpredictable behaviour you might expect when exceeding array limits. Would be helpful, however, to have some check within the %pl coding to prevent it, and instead give some proper error message.
_________________
(Steve Henley) |
|
| Back to top |
|
|
Kenneth_Smith
Joined: 18 May 2012
Posts: 866
Location: Lanarkshire, Scotland.
|
| Posted: Mon Feb 19, 2018 1:41 pm Post subject: |
|
|
A minor suggestion.
We have the subroutine get_plot_point@(x1,y1,xx1,yy1) which returns the pixel coordinates xx1, yy1, of the real world data x1, y1.
It would make programming interactively with mouse clicks etc on a %pl graphics area easier if there was a second subroutine which performed the reverse function, i.e. given pixel coordinates xx1, yy1, returns the real world coordinates x1, y1. I know this functionality can be achieved in otherways, but this complicates the programming.
Just a thought.
Ken |
|
| Back to top |
|
|
Kenneth_Smith
Joined: 18 May 2012
Posts: 866
Location: Lanarkshire, Scotland.
|
| Posted: Mon Feb 19, 2018 2:48 pm Post subject: |
|
|
And another suggestion, maybe a way of detecting the first call to the %pl call back function via CLEARWIN_STRING@( STR )
Ken |
|
| Back to top |
|
|
PaulLaidler
Site Admin
Joined: 21 Feb 2005
Posts: 8310
Location: Salford, UK
|
| Posted: Mon Feb 19, 2018 5:10 pm Post subject: |
|
|
Ken
The routine that you want is already included but perhaps not yet released.
The clearwin_info@("CALLBACK_REASON") for a %pl callback is "PLOT_ADJUST". I guess that the user's code could flag the first call. |
|
| Back to top |
|
|
silicondale
Joined: 15 Mar 2007
Posts: 252
Location: Matlock, Derbyshire, UK
|
| Posted: Wed Feb 21, 2018 11:01 am Post subject: |
|
|
Hi, John-S: 30 years ago I implemented an interactive graphics system that did exactly that, all in standard Fortran77. I'll see if I can find the low-level parts of the coding (should still have it somewhere). However, it won't fit easily with %pl because it overlapped a lot with the Simpleplot / %pl functionality. There seems to be a lot of reinventing of wheels, because mine was far from the only package that did the same job.
_________________
(Steve Henley) |
|
| Back to top |
|
|
DanRRight
Joined: 10 Mar 2008
Posts: 2959
Location: South Pole, Antarctica
|
| Posted: Sun Apr 15, 2018 11:38 am Post subject: |
|
|
Paul,
I checked 8.30 with DLL23
Looks like for linear scale plots the placing of numbers on axis were fixed so that plot has now reasonable amount of numbers per axis and the numbers itself are not looking "bad".
The next would be great to fix bugs in LOG scale which are long overdue. The %pl then will be very useful tool. The examples of the bugs are described and pictured in detail in my last post on page 4 of this thread.
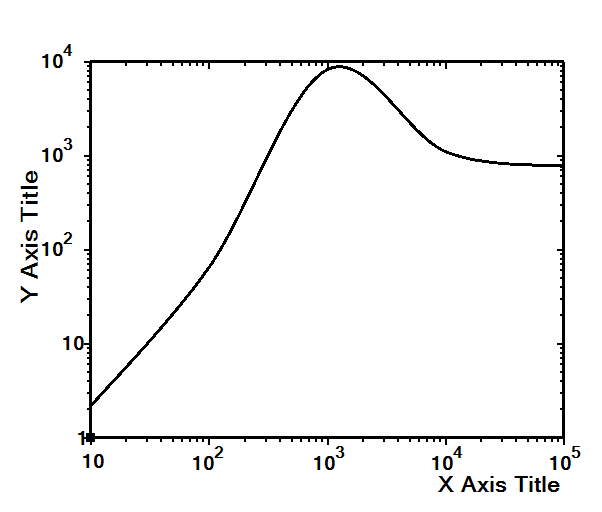
One more thing: a bug was introduced with the framed plot, you can see here that the thickness of the line of the frame is not the same:
| Code: |
use clrwin
parameter (N=5)
real*8 X(N), Y(N)
Data X/1e1, 1e2, 1e3, 1e4, 1e5/
Data Y/2.2, 66, 8333, 1111, 777/
i=winio@('%sf%ts%bf%es&', 2d0)
call winop@("%pl[axes_pen=3,width=3,x_axis='X Axis Title',y_axis='Y Axis Title']")
i=winio@('%ww%pv%pl[native,framed,x_array,scale=log_log,N_GRAPHS=1]', 625,500, n, X, Y)
end |
|
|
| Back to top |
|
|
PaulLaidler
Site Admin
Joined: 21 Feb 2005
Posts: 8310
Location: Salford, UK
|
| Posted: Mon Apr 16, 2018 12:58 pm Post subject: |
|
|
The option [frame_pen=dval] now provides the line width of the frame where dval is the width.
If you can post or send me the code for the bug then I will aim to look into it when time permits. |
|
| Back to top |
|
|
DanRRight
Joined: 10 Mar 2008
Posts: 2959
Location: South Pole, Antarctica
|
| Posted: Mon Apr 16, 2018 1:45 pm Post subject: |
|
|
Thanks for new option. As to the codes they are here, cited from page 4 above
| DanRRight wrote: |
1)
| Code: |
use clrwin
parameter (N=5)
real*8 X(N), Y(N)
Data X/1e1, 1e2, 1e3, 1e4, 1e5/
Data Y/2.2, 66, 8333, 1111, 777/
i=winio@('%ww%pv%pl[framed,x_array,scale=log_log,N_GRAPHS=1]%es', 625,500, N, X, Y)
end |
Problem: if you try to resize the plot just a tiny bit pulling window border or corner using mouse it abruptly displays Y correctly but X not.
2) The same code with "beautifications" with just one-two more lines of code like here looks better. This kind of line widths and design actually have to be a default, and the code above has to be like this one below
| Code: |
use clrwin
parameter (N=5)
real*8 X(N), Y(N)
Data X/1e1, 1e2, 1e3, 1e4, 1e5/
Data Y/2.2, 66, 8333, 1111, 777/
i=winio@('%sf%ts%bf%es&', 2d0)
call winop@("%pl[axes_pen=3,width=3,x_axis='X Axis Title',y_axis='Y Axis Title']")
i=winio@('%ww%pv%pl[native,framed,x_array,scale=log_log,N_GRAPHS=1]', 625,500, n, X, Y)
end |
In other words, the lines for axis and curves with default width 1 pixel are unacceptable as a default. Such beautifications take a lot of time and always causes many recompilations. If Clearwin will make good looking plots it will be accepted like Matlab.
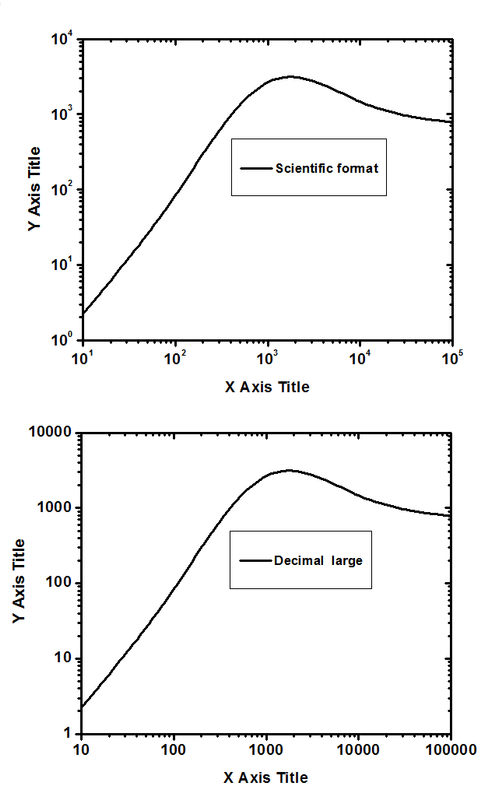
3) Additional problems: this nicer looking example shows the defects of absence of Scientific, Decimal etc numbering formatting options: the numbering does not look concise, in one style, it mixes different styles.
As to the numbering formats of LOG plots we here suggested to introduce few distinct user-definable formatting options: Scientific (numbers shown as 10^0, 10^1, 10^2, 10^3 etc) and Decimal (1, 10, 100, 1000...). All these ( and few other options like Engineering (1e0, 1e1, 1e2, 1e3) and Decimal with FP (1.0, 2.0, 3.0) ) are already there, they just need to be introduced into the user changeable settings.
With the LOG scale it is often possible for the code to choose these formats automatically: if the numbers are very small or very large and there are a lot of orders of magnitude to display then just the Scientific format has to be used
At the end here how this exact XY data is visualized by the professional scientific software using Scientific and Decimal formats. As you can compare the new %PL is already pretty close to the best of the best (the new PL can also do antialiasing for curves and in this example is even better doing data interpolation - compare how 8333 peak values are displayed)
Decimal format is of course the most difficult. If extend the plotted data to
| Code: |
0.01 0.011
0.1 0.044
1 0.33
10 2.2
100 66
1000 8333
10000 1111
100000 777 |
the OriginLab plots it this way
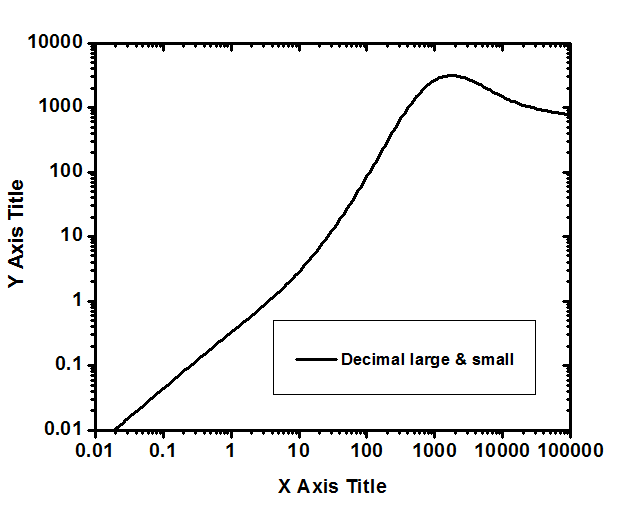
and if even more then 1e-3, 1e-4 ... |
|
|
| Back to top |
|
|
PaulLaidler
Site Admin
Joined: 21 Feb 2005
Posts: 8310
Location: Salford, UK
|
| Posted: Tue Apr 17, 2018 1:00 pm Post subject: |
|
|
Item 1 has now been fixed.
Improvements relating to item 3 might be possible later if time permits. |
|
| Back to top |
|
|
DanRRight
Joined: 10 Mar 2008
Posts: 2959
Location: South Pole, Antarctica
|
| Posted: Wed Apr 18, 2018 2:54 pm Post subject: |
|
|
John,
1) There is no way to get not only production quality but any quality if axes_pen=1,width=1. But i agree my axes_pen=3, width=3 are probably too aggressive for anyone who uses less then 4K monitors. Try =2 and tell if that will look better (but take in mind that there is a bug with the frame width Paul just fixed)
So size=1 is too small for almost anyone but 3 are too large for anyone who use smaller resolutions. Of course with time all monitors will be 4K, 5K 8K, their prices dropped 10 times in last 3 years, i'v heard the first cell phone with 4k screen was just made. But the best solution which will fit everyone would be ( before it is too late and user base will be large) for Paul to consider the fp numbers for axes_pen and line width instead of integer numbers because antialiasing can allow any intermediate numbers like 1.4 and the plot automatically will look much better with line sizes larger then primitive 1 pixel
Though there might be people with low res monitors I strongly insist to not use 1 pixel for default, because no one in the world use that. Everyone who did all got out of business, just look at any packages of scientific graphics for Fortran over last 30 years supplied by such losers. While at the same time the Matlab for example almost killed all, taking lion part of the market share from Fortran. And when you will think why, you will find that the only what Matlab sells (having similar language with Fortran while Fortran is faster and more modern) all others missed is 1) ultimate simplicity 2) stellar graphics. Same was with Apple for example: ultimate simplicity, top parameters and stellar aesthetics. Same with Amazon: ultimate simplicity (one click orders), top convenience, good design. At the end anyone with very low res monitors can decrease line widths but for everyone else first look of the plot has to cause WOW effect (not the feelings that Fortran is the neanderthal's language like right now)
2) If i either decrease the plot size to zero by mouse resizing or minimize the plot it immediately crashes.
Last edited by DanRRight on Wed Apr 18, 2018 3:25 pm; edited 1 time in total |
|
| Back to top |
|
|
DanRRight
Joined: 10 Mar 2008
Posts: 2959
Location: South Pole, Antarctica
|
| Posted: Tue Jun 26, 2018 12:38 am Post subject: |
|
|
| Paul, I hope you received on May 28 my email with demonstration of native PL crashing. |
|
| Back to top |
|
|
|
|
You cannot post new topics in this forum
You cannot reply to topics in this forum
You cannot edit your posts in this forum
You cannot delete your posts in this forum
You cannot vote in polls in this forum
|
Powered by phpBB © 2001, 2005 phpBB Group
|

