 |
forums.silverfrost.com
Welcome to the Silverfrost forums
|
| View previous topic :: View next topic |
| Author |
Message |
aebolzan
Joined: 06 Jul 2007
Posts: 229
Location: La Plata, Argentina
|
 Posted: Sat Jun 14, 2014 8:29 pm Post subject: Re: Posted: Sat Jun 14, 2014 8:29 pm Post subject: Re: |
 |
|
| DanRRight wrote: |
The right one is how i like %pl to look as an absolute minimum |
well....I WAS WRONG!....%pl is limited but not as much as I thought.
test this code and tell me if you like it....
| Code: | Program simple5
use mswin
INTEGER winio@,i,StartCB
EXTERNAL StartCB
i=winio@('%sy[no_border]%ca[User drawn]&')
i=winio@('%pl[user_drawn]&',800,800)
i=winio@('%sc',StartCB)
END
!--The start-up callback
INTEGER FUNCTION StartCB()
use mswin
INTEGER N,i
PARAMETER(N=101)
REAL x(N),y(N)
!--Create the data.
DO i=1,N
x(i)=i-1
y(i)=x(i)**2
ENDDO
!--Call SIMPLEPLOT routines to plot the graph.
call picpos(4.0,5.0) ! locate the graph in the page so that everything enters
CALL TITLE7('centre','Centre','Sample for Dan')
CALL SCALES(0.0,10.0,1,0.0,100.0,1)
call thckmg('LINE',1.0) !thickness of lines
CALL NEWPIC
CALL TITLE7('t','Centre','Sample')
call textmg(1.5) !size of the text
call axsbtk('XC','I') !ticks inside for x axis
call axsbtk('YC','O') ! ticks outside for y axis
CALL AXLBJS('**', 'Centre') ! labels centred
call chset(8) ! character set
call cvtype(ctype) ! curve type
call thckmg('LINE',3.0) !thickness of lines
call pen(4) !pen colour
CALL AXIS7('XCartesian','x-axis')
CALL AXIS7('YCartesian',' ')
CALL AXLOCN('YCartesian', 'Following') ! locate a new y axis on right
call axlban('yc','O') ! tick labels towards the outside
call axsbtk('yc','O') !ticks outside for y axis on the right
!call axclr('yc',1)! only axis is drawn without ticks if you prefer
CALL AXIS7('YCartesian','y-axis')
call axis7('YC',' ') ! draw the new y axis without title
CALL AXLOCN('XCartesian', 'Following') !locate a new x axis on top
call axlban('xc','N') ! no tick labels
call axsbtk('xc','I') ! ticks inside
call axis7('XC',' ') ! no axis label
call thckmg('L',1.0) !line thickness = 1
call pen(2)! colour red
CALL BRKNCV(x,y,N,-1)
CALL SIMPLEPLOT_REDRAW@
StartCB=1
END
|
four axis, ticks, labels, pen colours, line thicknesses, etc....I think that we don't need to redesign %pl for the moment and leave Paul thinking about other problems....
Hope this helps ,
Agustin 
Last edited by aebolzan on Sat Jun 14, 2014 11:58 pm; edited 1 time in total |
|
| Back to top |
|
 |
John-Silver

Joined: 30 Jul 2013
Posts: 1520
Location: Aerospace Valley
|
| Posted: Sat Jun 14, 2014 11:54 pm Post subject: |
|
|
Maybe I'mwrong but I don't think this is what Dan meant Agustin.
What he's 'looking'/hoping for is all you've written there but built into new additional parameters in the %pl command. (which then internally call the relevant Simpleplot commands as necessaryi.e. 'wrapping' and making the details of the command invisible to the user. |
|
| Back to top |
|
|
aebolzan
Joined: 06 Jul 2007
Posts: 229
Location: La Plata, Argentina
|
| Posted: Sun Jun 15, 2014 12:06 am Post subject: |
|
|
yes, I know......but in the last post he only said that he wanted that for %pl without any particular specification  ......so I am allowed now to say that "with %pl you can..." ......so I am allowed now to say that "with %pl you can..." 
Agustin |
|
| Back to top |
|
|
DanRRight
Joined: 10 Mar 2008
Posts: 2815
Location: South Pole, Antarctica
|
| Posted: Sun Jun 15, 2014 6:44 am Post subject: |
|
|
Agustin,
The whole idea is to have a graphics package which produces professional quality plots which do not need much further work (means the plots which are almost 99% ready to be placed into presentation or any high level publication).
Simpleplot is not the one, at least i have not seen almost anything decent looking. There is no sense to have just SIMPLE plots any way besides %pl, any other "harder" way we can do that themselves via FTN95 graphics library - it is where FTN95 is so unique. We will then 100% control every aspect of own graphics package. This saves time
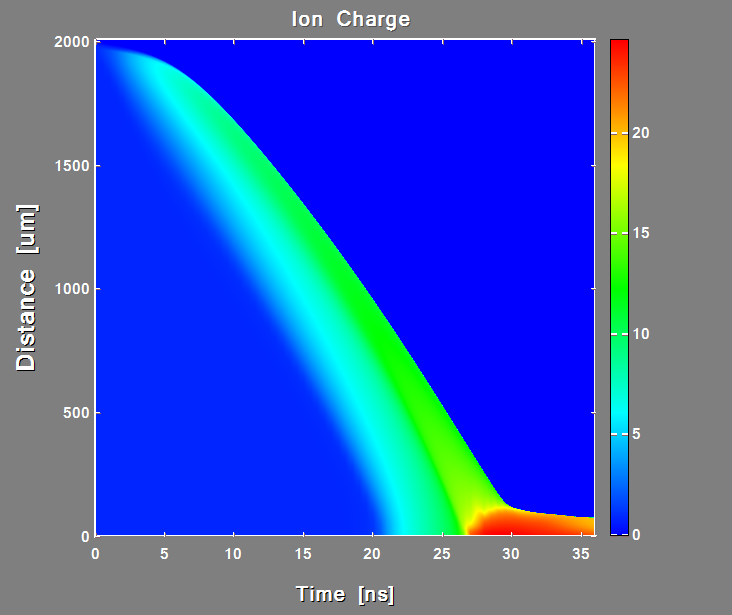
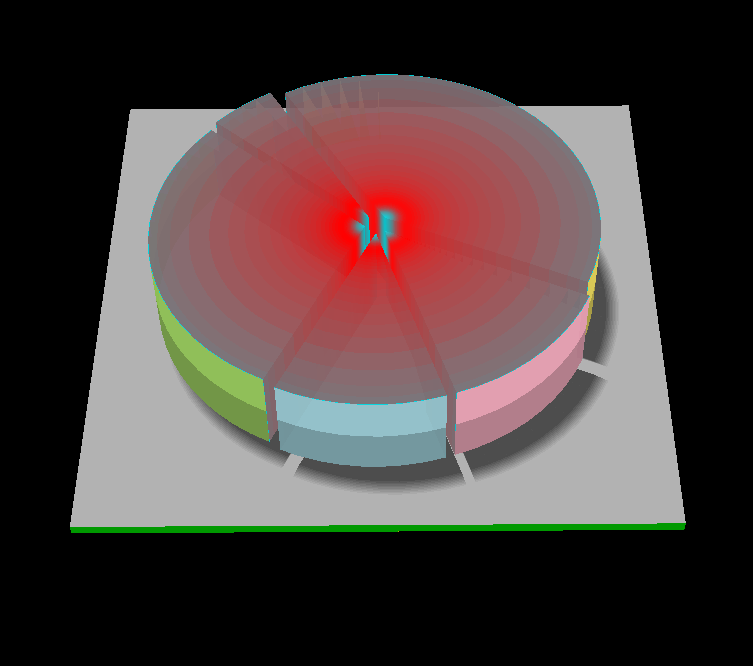
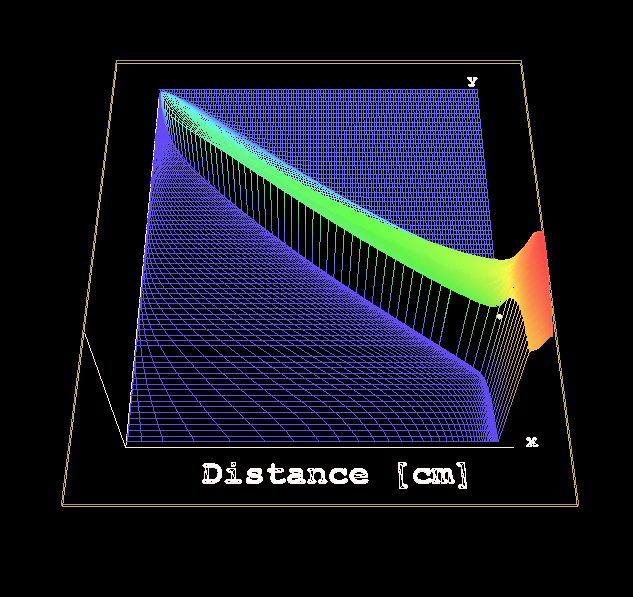
Here is what FTN95 can do easily - Surfaceplot, PieChart, 3D plot (these are just tiny parts of my code, there are 100s of graphs there, just the temporal Simleplot %pl i counted more then 40 instances). When you prepare the presentation you just grab by PrintScr the graphs from the screens (or FTN95 also allows to select part of image with mouse and save it in graphics format) and you are done in no time. The FTN95 is like a Gozdzilla versus all other mostly uninspiring Fortran compilers, the only it lacks is 64bits. If FTN95 developers controlled the Simpleplot sources (and opened them) then Simpleplot had a chance, it is designed not as bad actually, it just looks bad, which is fixable in a month
 |
|
| Back to top |
|
|
DavidButland
Joined: 15 Jun 2014
Posts: 2
Location: Bridlington
|
| Posted: Sun Jun 15, 2014 1:57 pm Post subject: Simpleplot |
|
|
Hello, world.
I very sensibly married Judy Butland in 1964. Judy developed Simpleplot in 1974 at the University of Bradford, UK.
We were AMAZED to find people still talking about Simpleplot in 2014.
We are now well into our happy retirement in Bridlington, E Riding of Yorkshire, and the Centre of the Universe.
We will help with Simpleplot problems if we can, but can promise nothing. It was all a long time ago.
Meanwhile, we are helping 2 local school students develop BridPlot - an Android app for graphing. See www.bussmk2.co.uk for more details.
BrodPlot is "Designed by School Students in the UK for School Students all over the world". If anyone has any contacts with schools in Foreign Parts, we would love to hear from them.
If any old Simpleplot uses who still remember us are out there, get in touch.
David Butland |
|
| Back to top |
|
|
DanRRight
Joined: 10 Mar 2008
Posts: 2815
Location: South Pole, Antarctica
|
| Posted: Sun Jun 15, 2014 3:22 pm Post subject: |
|
|
Dear David,
That was great news to meet you here in good mood and spirit! I do not know how many times we discussed here Simpleplot with all the regrets that you are not responding on emails because of your retirement. The feeling of serious loss was always the main theme. Please do not disappear and keep in touch with this group. Things are that time came to make for Simpleplot needed facelift and make some other fixes. I looked at your BrodPlot and was thinking that it is exactly what Simpleplot currently needs - to be both Simple and Pro, not just simple.
Besides i hope also that Windows tablets and cellphones will be next where this Fortran will be used so it would be great to see BrodPlot ported to Windows and able to communicate with Fortran.
Wish you all the best and a lot of fruitful communications with this one of the most friendly and caring communities on the web. |
|
| Back to top |
|
|
DanRRight
Joined: 10 Mar 2008
Posts: 2815
Location: South Pole, Antarctica
|
| Posted: Mon Jun 16, 2014 10:08 am Post subject: |
|
|
I am mostly interested with quick plot function %pl which we discussed at the beginning of this thread. What needs to be fixed urgently there is
1) fonts
2) tick marks
3) real*8 for graphics
4) fix %pl numerous inconsistencies and bugs (like simpleplot_redraw@, inconsistency of using real*4 vs real*8 for max and min while using real*8 for everything else etc) adjustments of drawing surface to get scalable borders instead of fixed etc
Most of all if compiler developers have no access to the graphics library source code and the rights for its modification like it was so far then Simpleplot (or any other third part software) has no future because of a lot of adjustments and modifications are needed permanently and each user has own preferences. May be even better is to grant access to sources for everyone like it is the case with many other graphics packages but that is debatable. When i found that Silverfrost developers can not fix with %pl anything i stopped using it and not without regret switched to my own library made with FTN95 graphics functions. I lost a lot of time but you can see the screenshots above -- obtained plotting quality and freedom was worth of that time loss. I still admit that design principles of %pl and Simpleplot and their integration into FTN95 are better then mine, because i am not a professional programmer. If Simpleplot major defects will be fixed and appearance substantially improved (which based on my experience is really really easy, i hope) i may start using it again.
If that will be solved next would be expansion of options for %pl to allow it draw a lot more and better with the same ease. That may take many users and years to do. But if done right Clearwin will be used indefinitely, scientific plotting will be need in year 3000 too, and simplicity is its key principle, am i wrong? LOL
Other users have interest in the whole Simpleplot package. It also needs improvements and adjustments to look more modern. Most of fixes (again, using modern fonts and their positioning relative to tics, real*8 numbering, labeling, using RGB colors and better looking palettes etc) could be done pretty fast. The reason to switch to real*8 numbers is because that allows to get much less amount of annoying crashes of graphics, since it is pretty rare when you get numbers more or less then 1e300 or 1e-300 while this permanently happen with real*4 numbers |
|
| Back to top |
|
|
DanRRight
Joined: 10 Mar 2008
Posts: 2815
Location: South Pole, Antarctica
|
| Posted: Tue Sep 09, 2014 2:48 am Post subject: |
|
|
Remember the Simpleplot hack our forum guys uncovered which fixes tick marks?
I got strange error which looks like this when i open same program twice(no matter where in the computer)

Any guess what that could be?
Here is the code for debugging. Run one exe and then not closing it run the another
| Code: |
!-------------------------------------------------------
! Compilation:
!
!ftn95 aaa.for /free /debug /no_truncate /undef
!slink aaa.obj SIMPLE.DLL
!
!-------------------------------------------------------
Program simple
Real*8 x(100), y(100), z(100), u(100), v(100), w(100)
N=100
do i=1,N;
x(i)=i-1;
y(i)=sin(i/30.)**2;
z(i)=sin(i/30.)**5;
u(i)=sin(i/30.)**10;
v(i)=cos(i/30.)**10;
w(i)=sin(i/30.)**2 * cos(i/30.)**2;
enddo
CALL TEXTMN(0.3)
CALL AXLBJS('*C','C')
call thckmg('LINE',3.0)
call chset(10)
i=winio@('%ww%pv%pl[x_axis="Time [s]",y_axis=Amplitude,&
&title="U(red, green-analit), U_A on load(orange), I(blue, black-anal)", &
& x_array, colour=red, colour=blue, colour=green, colour=black, &
&colour=#CC8800, X_ARRAY, N_GRAPHS=5]&',&
& 300, 200, N-4, x, y, z, u, v, w)
i=winio@('%ac[esc]', 'exit')
End |
Also, this question is to Silverfrost: did you guys establish any communications with David Butland to solve Simpleplot problems? Any agreements on source code ?colour=#CC8800, X_ARRAY, N_GRAPHS=5 |
|
| Back to top |
|
|
aebolzan
Joined: 06 Jul 2007
Posts: 229
Location: La Plata, Argentina
|
| Posted: Fri Sep 12, 2014 5:18 pm Post subject: |
|
|
I was testing your program and seems that the problem is with %pl. I have tried a modified version of it:
| Code: | Program simple
use mswin
INTEGER winio@,i,StartCB
EXTERNAL StartCB
i=winio@('%sy[no_border]%ca[User drawn]&')
i=winio@('%pl[user_drawn]&',800,800)
i=winio@('%sc',StartCB)
END
!--The start-up callback
INTEGER FUNCTION StartCB()
use mswin !INCLUDE 'CLEARWIN.INS'
INTEGER N,i
integer*4 :: ans
!--Call SIMPLEPLOT routines to plot the graph.
Real*4 x(100), y(100), z(100), u(100), v(100), w(100)
N=100
do i=1,N;
x(i)=i-1;
y(i)=sin(i/30.)**2;
z(i)=sin(i/30.)**5;
u(i)=sin(i/30.)**10;
v(i)=cos(i/30.)**10;
w(i)=sin(i/30.)**2 * cos(i/30.)**2;
enddo
call chset(25)
call axsbtk('XC','I')
call axsbtk('YC','O')
CALL AXLBJS('**', 'Centre')
call thckmg('L',2.0)
CALL SCALES(0.0,100.0,1,0.0,1.0,1)
call axes7('x-axis','y-axes')
call pen(1)
CALL BRKNCV(x,w,N,1)
call pen(2)
CALL BRKNCV(x,y,N,1)
call pen(3)
CALL BRKNCV(x,z,N,1)
call pen(4)
CALL BRKNCV(x,u,N,1)
call pen(5)
CALL BRKNCV(x,v,N,1)
call endplt
CALL SIMPLEPLOT_REDRAW@
StartCB=1
END
|
and I can open this program twice, even in the same folder....it seems that when you use Simpleplot subroutines directly, it works fine but as "implicit" subroutines in %pl, does not. Therefore, it appears to be a problem with the implementation of %pl, not Simpleplot....
Hope this helps....
Agustin
P.D. as you say, it would be nice to hear from Silverfrost if they have eventually agreed (or not) with David Butland to work on an updated implementation of Simpleplot. |
|
| Back to top |
|
|
DanRRight
Joined: 10 Mar 2008
Posts: 2815
Location: South Pole, Antarctica
|
| Posted: Fri Sep 12, 2014 11:07 pm Post subject: |
|
|
Thanks Agustin. yes, would be nice if Silverfrost will get some sort of new collaboration with D.Butland or even his school students who made amazingly good graphics utility for Android which costs just a dollar on Google Play OR l get the ability to edit the source code.
Otherwise the Simpleplot is dead. |
|
| Back to top |
|
|
John-Silver
Joined: 30 Jul 2013
Posts: 1520
Location: Aerospace Valley
|
| Posted: Sat Sep 13, 2014 8:20 pm Post subject: |
|
|
Dan,
x_array and X_ARRAY both appear in your %pl statement, could that be the cause ?????
John |
|
| Back to top |
|
|
DanRRight
Joined: 10 Mar 2008
Posts: 2815
Location: South Pole, Antarctica
|
| Posted: Mon Sep 15, 2014 6:17 am Post subject: |
|
|
John,
Good that you have noticed the typo/bug, but good is that %pl is resistant to it. Still attempt to run any second code with %pl crashes it. |
|
| Back to top |
|
|
DanRRight
Joined: 10 Mar 2008
Posts: 2815
Location: South Pole, Antarctica
|
| Posted: Mon Sep 15, 2014 10:17 am Post subject: |
|
|
I'd also appreciate if our Simpleplot hacks solved one more its problem which makes it an FUglyplot: fonts for LOG scale's exponent. Here is how moronic looks scientific numbering right now: the exponent font is taken as way way too small even after i increased all font sizes. Can you guys fix it with some workaround?
 |
|
| Back to top |
|
|
aebolzan
Joined: 06 Jul 2007
Posts: 229
Location: La Plata, Argentina
|
| Posted: Mon Sep 15, 2014 2:12 pm Post subject: |
|
|
within the limitations of Simpleplot (till Silverfrost contacts David Butland...), the size of the fonts can be changed by means of the proper font used (chset(?) subroutine) or the size of the font (textmg (?) subroutine). I do not remember where I put the following program in the forums, but I resend it here as it will be faster for you to see it. As you will see, CHSET above 20 gives you a larger exponent font.....
| Code: |
program Simpleplot_plots
!requires simpleplot.dll
implicit none
real*4,dimension(70) ::xarr,yarr
integer*4 :: narr,ltype,xscale,yscale
integer*4 :: ctype,i,ans
character(8) :: xlabel="x",ylabel="y"
character(2) :: istr
real*4 :: minx,maxx,miny,maxy
narr=0
do i=1,70
xarr(i)=2*i
yarr(i)=i*i
narr=narr+1
end do
call group(2,2)
DO I=1,30
ans=i
call knumb(i,istr)
CALL AXLBJS('*C','C')
call textmg(1.0)
call axsbtk('XC','I')
call axsbtk('YC','O')
call thckmg('L',2.0)
CALL AXLBJS('**', 'Centre')
minx=minval(xarr)
maxx=maxval(xarr)
miny=minval(yarr)
maxy=maxval(yarr)
xscale=1;yscale=2 !linear scale for x, log scale for y
CALL SCALES(minx,maxx,xscale,miny,maxy,yscale)
call axcrss('YC',minx)
call pen(2)
ltype=0
ctype=3
call chset(ans)
call cvtype(ctype)
CALL BRKNCV(real(xarr,1),real(yarr,1),narr,ltype)
call pen(4)
CALL AXES7(xlabel, ylabel)
call title7("t","c","Character set "//istr//" ")
end do
call endplt
end program simpleplot_plots |
you have of course installed the Hershey fonts as described elsewhere in this forum...
Hope this helps,
Agustin |
|
| Back to top |
|
|
DanRRight
Joined: 10 Mar 2008
Posts: 2815
Location: South Pole, Antarctica
|
| Posted: Tue Sep 16, 2014 9:30 am Post subject: |
|
|
Agustin,
I forgot to mention that this has to be within %pl, I do not use full Simpleplot till it will be fixed and sources controlled by Silverfrost or users (sources opened).
Here is the demo for simplicity (why it produces zero size file "messages.txt" by the way?)
| Code: | !-------------------------------------------------------
! Compilation:
!
!ftn95 aaa.for /free /debug /no_truncate /undef
!slink aaa.obj SIMPLE.DLL
!
!-------------------------------------------------------
Program simple
Real*8 x(100), y(100), z(100), u(100), v(100), w(100)
N=100
A=20000
do i=1,N;
x(i)=i-1;
y(i)=A*sin(i/30.)**2;
z(i)=A*sin(i/30.)**5;
u(i)=A*sin(i/30.)**10;
v(i)=A*cos(i/30.)**10;
w(i)=A*sin(i/30.)**2 * cos(i/30.)**2;
enddo
CALL TEXTMN(0.35)
CALL AXLBJS('*C','C')
call thckmg('LINE',3.0)
call chset(10)
i=winio@('%ww%pv%pl[x_axis="Time [s]",y_axis=Amplitude,&
&title="U(red, green-analit), U_A on load(orange), I(blue, black-anal)", &
& x_array, colour=red, colour=blue, colour=green, colour=black, &
&colour=#CC8800, X_ARRAY, SCALE=LOG_LINEAR, N_GRAPHS=5]&',&
& 600, 400, N-4, x, y, z, u, v, w)
i=winio@('%ac[esc]', 'exit')
End |
Last edited by DanRRight on Thu Sep 18, 2014 12:40 am; edited 1 time in total |
|
| Back to top |
|
|
|
|
You cannot post new topics in this forum
You cannot reply to topics in this forum
You cannot edit your posts in this forum
You cannot delete your posts in this forum
You cannot vote in polls in this forum
|
Powered by phpBB © 2001, 2005 phpBB Group
|

